

Enough of Bitcoin bears, Bulls all set to take the charge, at-least based on market trends. There is a lot of confusion about bitcoin’s bottom among investors. Traders are looking at many different indicators and ignoring real price action and historical references. In this article, I will explain everything technically that why bitcoin has hit the bottom and what to see next.
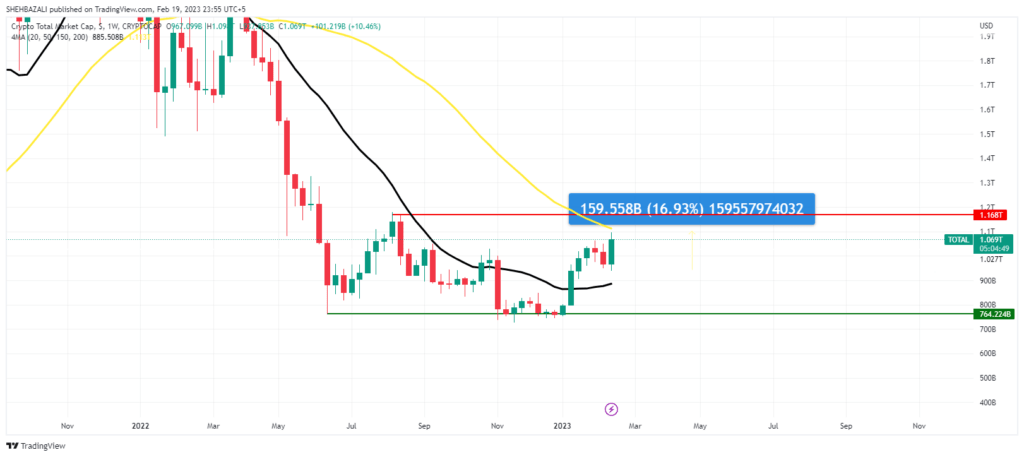
- Crypto Total Market Capitalization
The crypto total market cap has surged 16.93% this week. After two weeks of negative price action, the crypto total market cap is ready to close in green above $1.07 this week. Last week the crypto total cap closed at $967 billion. The crypto total market cap is facing resistance at 50 weekly moving.

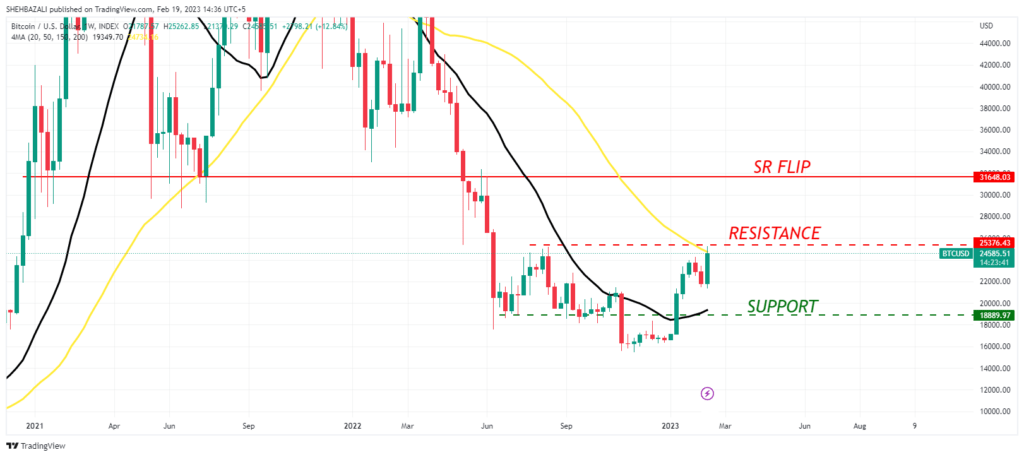
2. BTC This week’s price analysis
Bitcoin prices picked up on the news that Eazy Financial Services has collaborated with Novotel Bahrain Al Dana Resort. According to the news, Novotel Bahrain Al Dana Resort is now allowing its guest to pay in cryptocurrencies for different services.
- Currently, bitcoin is facing resistance at $25000, as discussed last week. If bitcoin breaks this level, the Crypto market will turn bullish, I will explain in a bit, how
- Bitcoin will test the next resistance of $31600 in 2-3 weeks, also an SR Flip zone, if breaks and holds above 50 weekly MA
- Traders are looking for support at $19500 in the worst case.
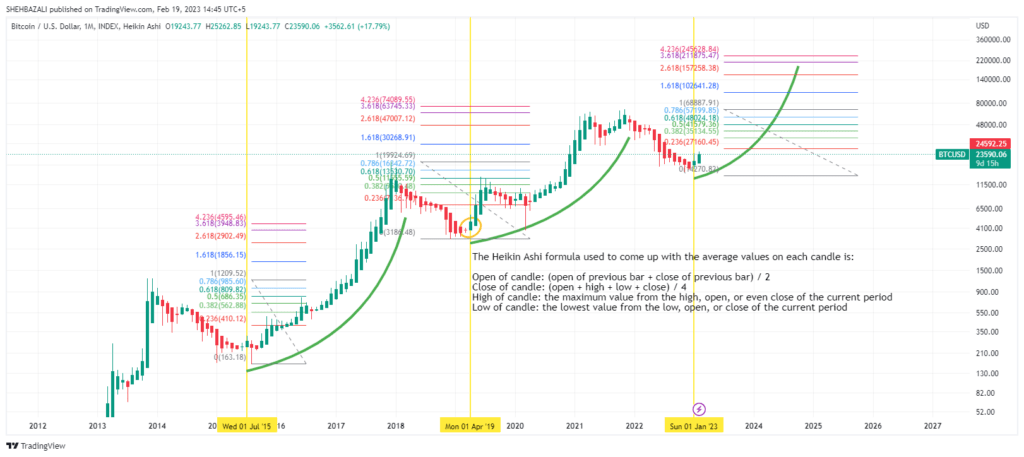
3. Bitcoin has hit the bottom
According to the four-year cycle, bitcoin tests the bottom within 450 days after making an all-time high. In Nov 2013, Bitcoin created the first all-time high of $1200 and BTC tested the bottom in January 2015, Within 450 days of the top.
In Dec 2017, bitcoin made a bull run top of the second cycle and tested the bottom after 364 days. And this time it has been more than 450 days if we count from Nov 2021.
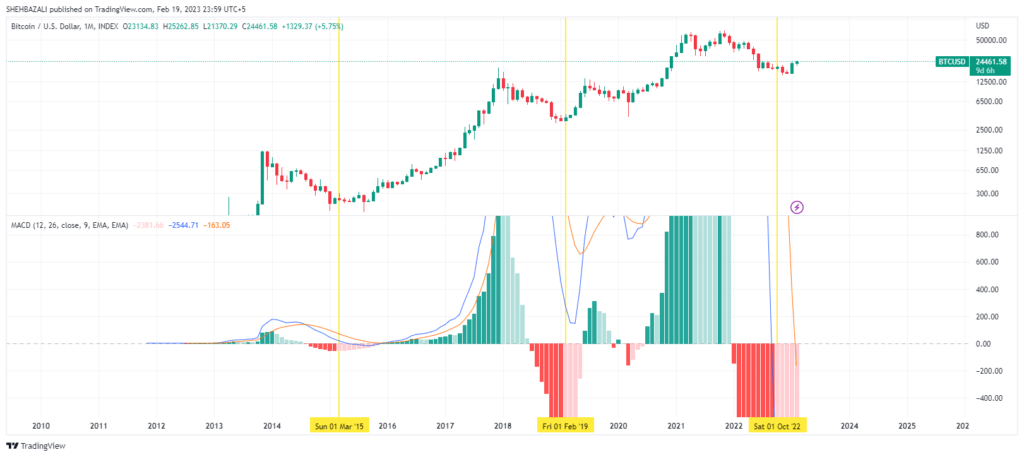
4. Bitcoin (BTC) Monthly MACD
If we look at the Moving Average Convergence Divergence (MACD), a momentum indicator. Historically, when MACD monthly loses sell momentum which means turns from dark red to light red on a monthly time frame. The market turns bullish and confirms the bottom, which previously happened in all cycles.
5. Morning Star
Morning Star is a bullish candle stick pattern, especially near the bottom, and on a higher time frame, it confirms the bottom. Last month Bitcoin (BTC) monthly candle closes with a big green candle and formed a perfect morning start at the bottom.
6. Volume
Last month, bitcoin attracted the highest buying volume after two years. This level of volume was seen in Feb 2021
7. Hiken Ashi
Technically, BTC confirms the Bear Market bottom, when Bitcoin (BTC) closes a first monthly candle green in the bear on Hiken Ashi Candle Stick Chart.
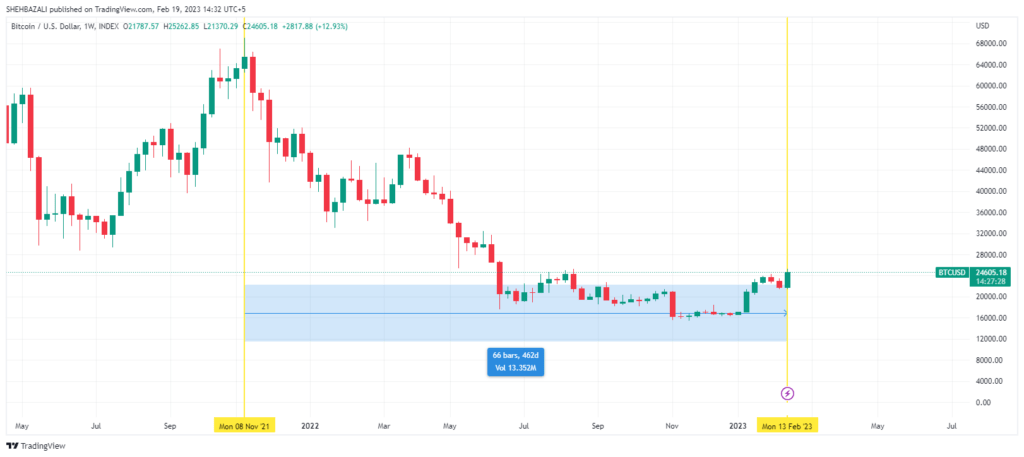
Two more signs will turn the market completely bullish. First, the crossover 20-50 weekly moving average. Second, BTC’s weekly closing is above the 50 weekly moving average. These two confirmations are due for now.
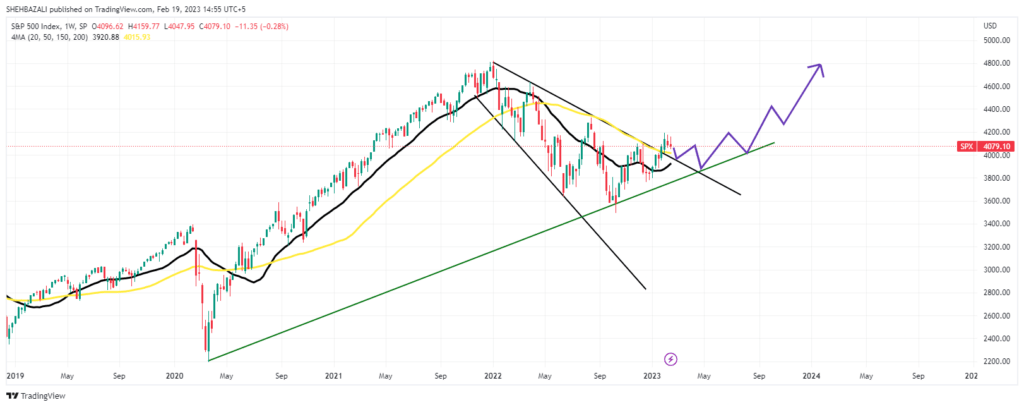
8. S&P 500
After testing a high of 4195, last month, the S&P 500 index closes this week at 4079. The S&P 500 closes this week at -0.30%. The S&P 500 broke out the ascending broadening wedge pattern, which is usually bullish but not a strong signal.
The S&P 500 is still under heavy sell pressure, which you can see in the chart. The last two weeks closing in a DOJI style confirms the indecision moment in the market. However, the good thing is that S&P 500 index is still holding above the 50 weekly moving average.

9. DXY
DXY (The US Dollar Index), made a high of 104.66 this week. DXY is facing resistance near the 105 level, The DXY has also rejected from this level last month.
On the weekly time frame, DXY is forming a right shoulder of the bearish Head & Shoulder Pattern. At the bottom, 101.99 will work as strong support, this type of support is also known as the neckline of the pattern.
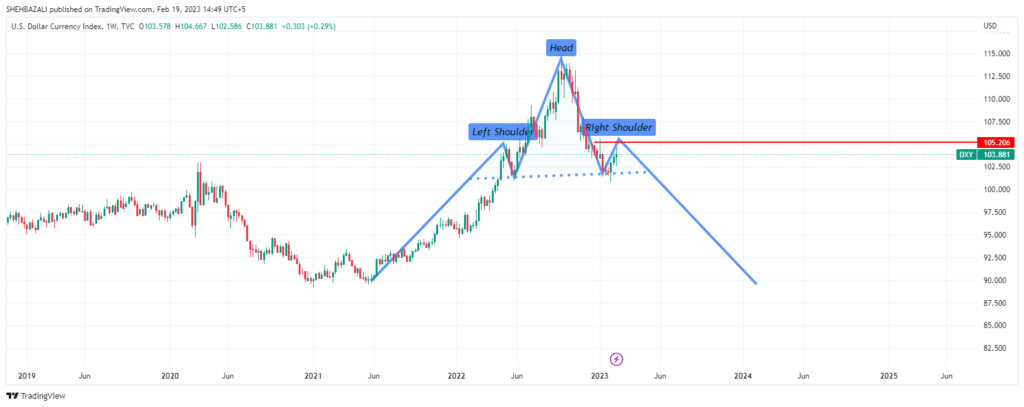
Image from: Tradingview and gettyimages.
*Disclaimer: All views expressed in this article is for educational purposes only and should not be constituted as financial advice.


Subscribe To Our Newsletter
Join our mailing list to receive the latest news and updates from our team.