

We have all been waiting for Bitcoin to reach new all-time highs, but unfortunately, this has been as elusive as a pot of gold at the end of a rainbow. The bear market has been brutal and we have seen several crypto institutions fall and we are still reeling from its effects. Some analysts are saying that we are seeing the start of the bull market and we have already seen the bottom. Don’t you wish that it was as easy as that?
As much as we want to be optimistic, there is no such thing as a guaranteed prediction. Weather forecasters have satellites and different meteorological tools, but they still can’t predict with 100% accuracy. It is the same way with crypto trading, we can use all the chart indicators but we are just trying to make an educated guess.
Let us look at charts and maybe it will give us more clues.
The Bitcoin Death Cross
In early September we saw a potential death cross. This event happens whenever a shorter, moving average crosses below a longer moving average. In our case, we used the 50 and 200 moving averages (MA).

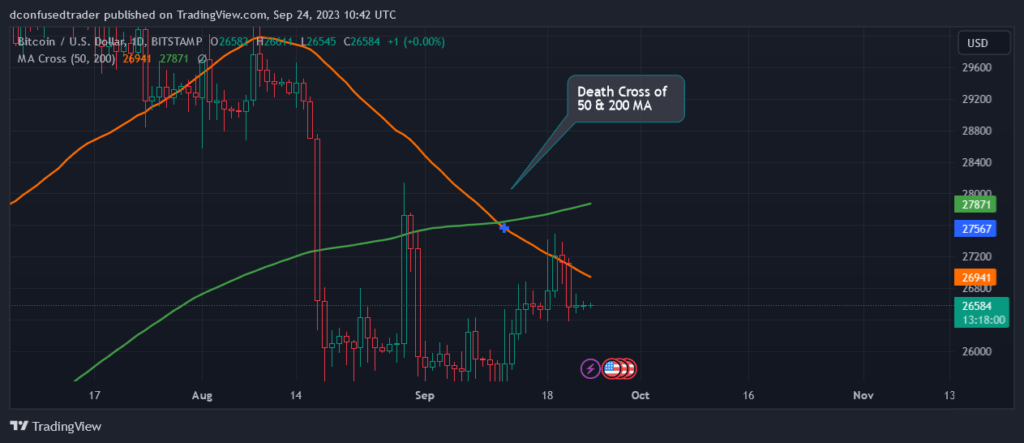
In the chart above we can see that the death cross, on the daily timeframe, has already occurred. We have to remember that these lines are like magnets. As we can see, the price tried to rally towards the MAs but failed to break through. It was rejected and is continuing into a downward trajectory. At the moment the MA lines are acting as resistance.
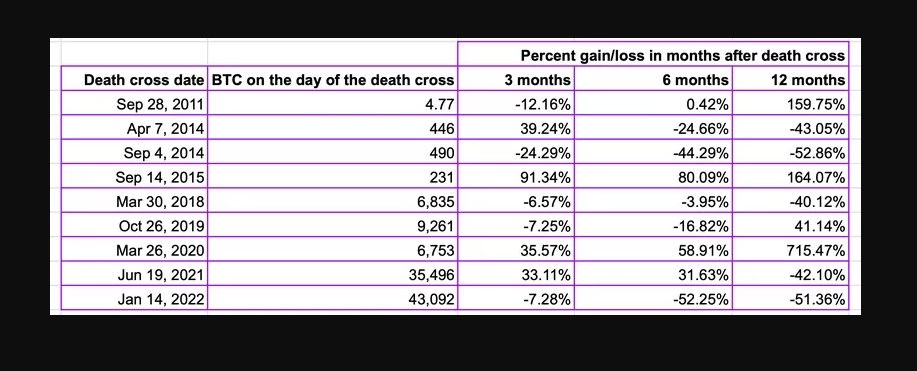
But should we panic and sell everything? Before you do that, there is also a CoinDesk report that shows that it is not all doom and gloom. In fact, BTC performed negatively 5 out of the 9 times after a death cross. The report included 3,6, and 12 months after the event occurred. So basically, it is a toss-up. A death cross does not guarantee that the price will plummet. The table below proves it:

Bitcoin has Strong Support at $25,000
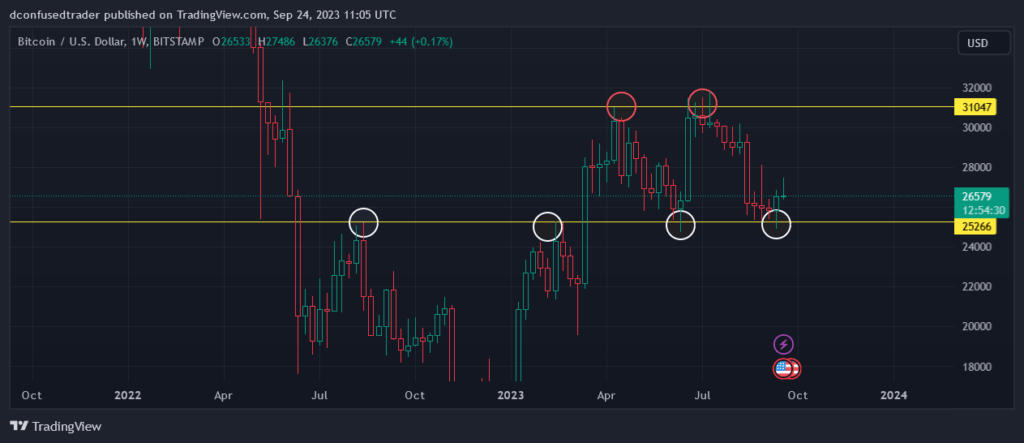
The chart above shows that the $25,000 level acted as resistance twice, so it was expected that would it be tested as support once it was breached. So far we have tested it successfully once, and we are waiting if the latest retest will send it to the 30-31k level.
The chart also clearly shows that the $31,000 level is strong resistance. Bitcoin was rejected twice after the push from the 25k level. We need to push through it before we even entertain any all-time highs scenario.
The Bullish Scenario for Bitcoin
If the 25k level holds support and we manage to defeat the 30-31k resistance, the next stop will be the 36k level. Why? This is a previous swing low and therefore we can draw a horizontal resistance line from it. As for confluence, 36k is also the 1.618 target and 0.618 Fibonacci target. The chart below will explain this.
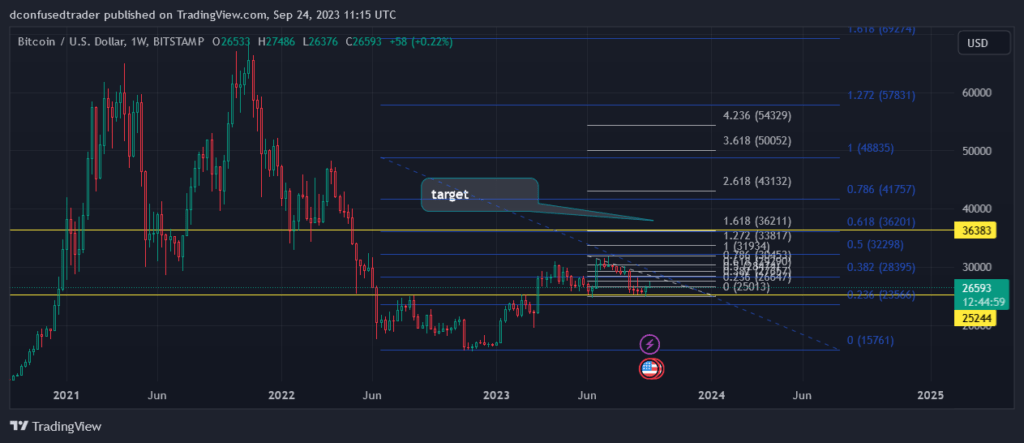
Notice that the bigger Fibonacci retracement (in blue) shows that 36k is the 0.618 target. While the smaller Fib retracement (in white), shows 36k as the 1.618 target. It is uncanny that they align, which may suggest a high probability that this is the next resistance after 31k.
The Bearish Scenario for Bitcoin
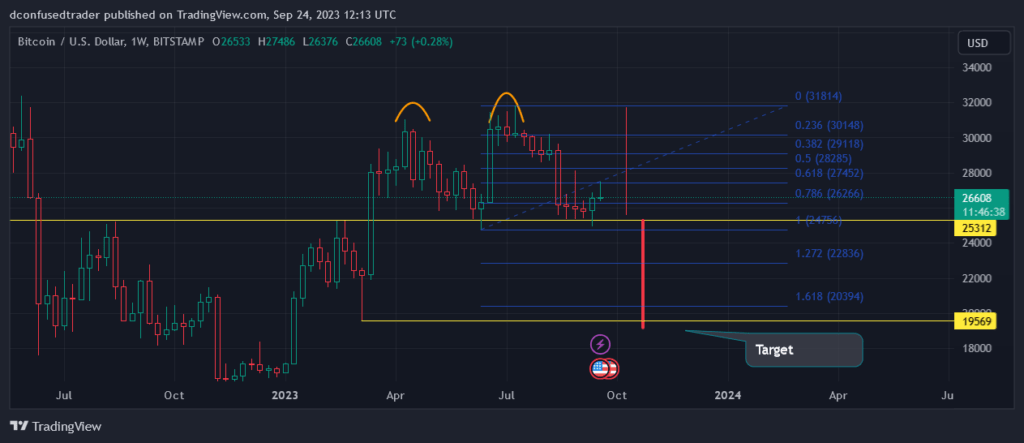
There is also a possibility that the price will go down. If we lose the 25k level, we will be forming a technical double-top pattern. If this happens, our price target will be sub-20k. This coincides with the March low of around 19k. It will also be near the 1.618 Fibonacci target.
Bitcoin Liquidity Grab
Most of us are familiar with the term market makers. These institutions have so much money to trade that they cannot just simply buy or sell anytime. They need a lot of liquidity to to be able to fulfill their orders. Unlike retailers, who just probably just need a few thousand or hundreds of thousands in liquidity, these institutions trade to the tune of millions. So it is worth looking a market liquidity to check where they might place orders.

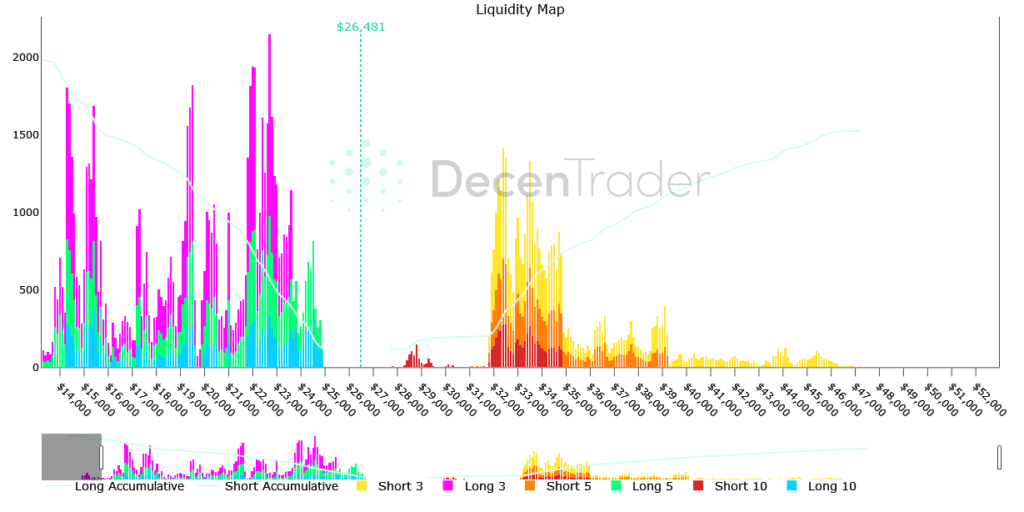
The chart above shows the liquidity of Bitcoin. A lot of shorts are piled up a the 32-35k level. Some shorts are also around the 28k level. A lot of longs are also piled up between the $22-23k level. These levels will be defended by both bears and bulls, so pay attention.
Beyond the Charts
There are always two sides to technical analysis. A bearish view and a bullish view. It is almost impossible to predict which one will prevail, but we can always look at the bigger macro factors to make better decisions.
- Spot Bitcoin ETFs filed by multiple financial institutions like BlackRock and Fidelity are still pending. Approval of these ETFs will probably pump prices.
- Always look at current monetary policies. The FOMC meets every 6 six weeks to discuss steps on how to support the economy. This Fed body has the power to raise or decrease interest rates. Higher interest rates mean less money in the market, which would also mean less money for risky investments like Bitcoin. So, always wait for the news.
- Always be on the lookout for any regulation or court ruling that might affect the crypto space. Of course, favorable regulation means higher prices and vice versa.
- Black swan events like the COVID lockdown, pushed down the price of Bitcoin.
- FUD or negative news will always pull the prices down. At the moment FUD surrounding Binance is probably the biggest one.
The news will be the catalyst for the next pump or dump. So always be informed.
So What Now?
Recap:
- We have a death cross on the daily time frame, but data shows that this is not always a sure bad thing.
- $25,000 is still the support to break
- Our present resistance is around the $31,000 level.
- If we break $31,000 level, the next target is $36,000. This is reinforced by Fibonacci levels. This was also a previous swing low.
- However, if we break $25,000, we might see a sub-20k price. We will be forming a double top with a target of below 20k. The 19k level is also the March low and this level is also a 1.618 Fib target
- Pay attention to liquidity at the 22-23k level, 28k level and 32-35k level.
- Look at the bigger picture, listen to news regarding crypto regulations, rate hikes, and other events
Saying we can either go up or down is akin to saying that we will probably have rain or sunshine tomorrow. But a well-prepared person will always bring an umbrella. It is the same when dealing with crypto assets. We are all familiar with the volatility of this sector, so we always look at different scenarios to mitigate risks. Being informed and prepared will spell the difference between profitability and being wrecked.
The information provided in this article is for informational purposes only and should not be considered financial advice. The article does not offer sufficient information to make investment decisions, nor does it constitute an offer, recommendation, or solicitation to buy or sell any financial instrument.


Subscribe To Our Newsletter
Join our mailing list to receive the latest news and updates from our team.