
- Bitcoin trades at $107,779 after falling below $108K with a 2.8% drop over 24 hours as market losses extend across major coins.
- More than $320M in crypto positions were liquidated and U.S. spot ETFs recorded $40.4M in net outflows including $100.7M from IBIT.
- Fear index stands at 34 in “Fear” zone while open interest drops by about 30% and funding moves close to neutral signaling lower leverage.
Bitcoin traded below $108,000 at 9:20 a.m. UTC, marking another cautious session as traders faced renewed liquidations and weaker spot ETF flows. The digital asset slipped to $107,779 in the European morning, reflecting a 2.8% loss in 24 hours and triggering a ripple effect across the market. Ether and solana both dropped over 3.5%, while the CoinDesk 20 Index fell around 3.5%, showing broader pressure on top cryptocurrencies. CoinGlass data revealed 122,919 traders were liquidated, with a total loss exceeding $320 million. The largest liquidation, worth $2.98 million on Binance, highlighted how leverage unwinding added to the volatility. Market sentiment sat at “Fear” on the Crypto Fear & Greed Index, while gold also slipped nearly 2%, suggesting global caution beyond crypto.
Bitcoin holds a lower range as the $108K level breaks
Bitcoin traded through the $108,000 handle after a busy liquidation sweep, with CoinGlass counting 122,919 traders closed out in the past 24 hours for a total of $320.32 million. The largest single print was a $2.98 million ETH-USDT order on Binance, which highlights how cross-asset leverage added to the flush even as Bitcoin set the tone. Price now sits inside a tight lower range, and intraday bounces remain brief while momentum cools. Intraday depth is thinner than last week, which makes each push more decisive and raises the chance of quick wick moves around round-number levels. Broader market context adds weight to the move. Many altcoins posted losses in excess of 4%, which aligns with a de-risking day rather than idiosyncratic news. Bitcoin often stabilizes first after leverage clears, but follow-through depends on spot demand reviving near visible levels. If that bid returns, a grind back over the former shelf near $108,000 would signal balance rather than a trend change. If it does not, the market risks a slow walk lower as traders cut exposure into late sessions.
ETF flows, fear gauge, and cross-asset context
Flows started the week on a softer footing. U.S. spot bitcoin ETFs recorded a net outflow of $40.4 million on Monday, Oct. 20, including a $100.7 million outflow from BlackRock’s IBIT, according to Farside Investors. These figures do not mark a structural break, yet they remove a source of steady demand that helped intraday support during stronger weeks. The Crypto Fear & Greed Index printed 34, which sits in “Fear” and is consistent with tighter risk budgets and slower dip-buying on first touch of support. Cross-asset signals lean cautious as well.

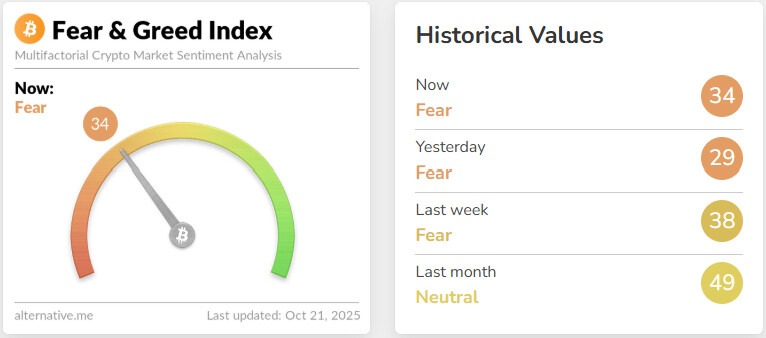
Bloomberg marked gold at $4,270 per ounce, down 1.97% on the day. When both Bitcoin and gold trade heavy at the same time, macro rather than sector news often drives the tape. The mix of a mild ETF outflow day, a risk-off bias in metals, and a broad crypto decline frames the move as part of a wider de-risk, not only a crypto-native event. That backdrop helps explain why rallies fade before prior highs even when order books look clean after liquidations.
Derivatives snapshot: open interest flush and funding near neutral

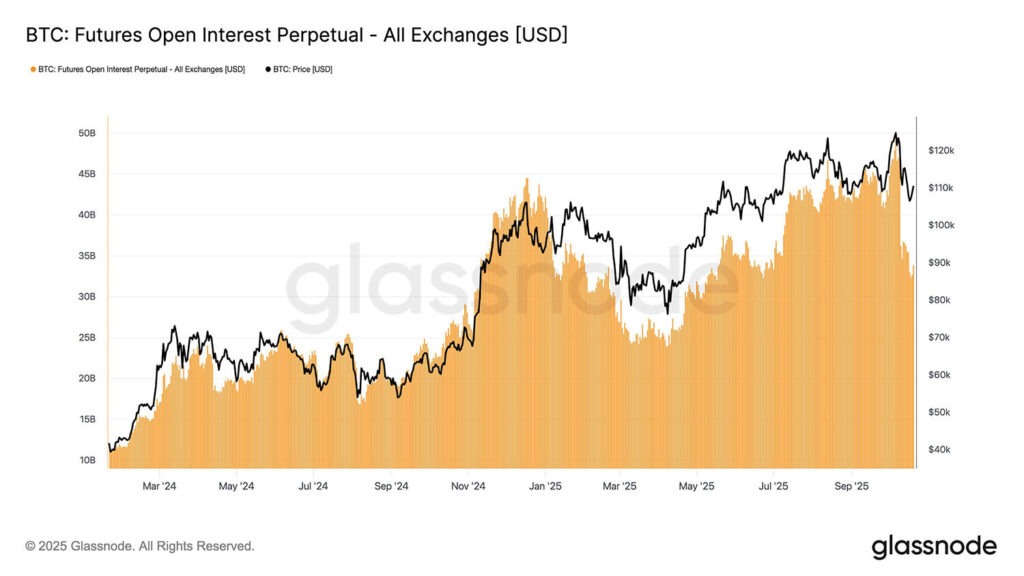
Glassnode reported that open interest fell about 30% into the drawdown, which suggests a sizable share of leverage left the system. Open interest tracks outstanding futures and perpetual positions; when it drops hard, traders have closed contracts or been forced out. That kind of flush often reduces the chance of another quick liquidation cascade because fewer weak hands remain with heavy leverage. Funding rates now sit near neutral, so neither longs nor shorts pay a notable premium to hold positions. Balanced funding reduces directional pressure and lets spot flows set the path. This reset matters for Bitcoin because trend days often start after leverage compresses and spot demand builds. If funding stays flat and open interest rebuilds slowly, the tape can base for several sessions without sharp tails. If open interest ramps too fast while spot remains quiet, the market risks another rinse. The mix today favors patience. Traders can read the next impulse from whether spot bids absorb dips near recent lows or whether supply returns on each uptick toward the $108,000 pivot.
Bitcoin monthly structure and what could come next
Analyst Michaël van de Poppe described the monthly chart as moving sideways with no clear peak or bottom before a larger move higher.
The idea fits with the current reset: a pause that runs long enough to shake out excess leverage while price holds within a broad range. In practical terms, Bitcoin needs time for base-building after the $108,000 breach and the $320.32 million liquidation wave. If buyers defend the lower half of the recent range and ETFs flip back to small inflows, a steady climb can follow without headline catalysts. Range dynamics guide the near term. Sideways monthly structure does not preclude active intraday trading; it warns against chasing each break as if a trend day has started. Spot demand should lead any sustained reversal, with derivatives confirming through rising open interest that does not push funding positive for long stretches. A move back over recent failed levels would confirm that the market absorbed supply, while a slip under the latest lows would keep attention on risk management rather than expansion.
Conclusion
Bitcoin sits below $108,000 after a 2.8% 24-hour slide to $107,779, with ether and solana down more than 3.5% and the CoinDesk 20 off about 3.5%. CoinGlass tallied 122,919 accounts liquidated for $320.32 million, including a $2.98 million ETH-USDT order on Binance, as leverage cleared and order books thinned. U.S. spot bitcoin ETFs posted a $40.4 million net outflow on Monday, Oct. 20, with $100.7 million from BlackRock’s IBIT, while the Crypto Fear & Greed Index printed 34 in “Fear”. Bloomberg showed gold at $4,270 per ounce, down 1.97% on the day, adding a macro risk tone. Glassnode flagged roughly a 30% drop in open interest and funding near neutral, a mix that can limit the odds of another forced-selling cascade but still allow choppy sessions. The monthly chart remains sideways, and base-building after the reset would set the stage for the next advance once spot demand and steady flows return.
Disclaimer
The information provided in this article is for informational purposes only and should not be considered financial advice. The article does not offer sufficient information to make investment decisions, nor does it constitute an offer, recommendation, or solicitation to buy or sell any financial instrument. The content is opinion of the author and does not reflect any view or suggestion or any kind of advise from CryptoNewsBytes.com. The author declares he does not hold any of the above mentioned tokens or received any incentive from any company.
Featured image created by AI


Subscribe To Our Newsletter
Join our mailing list to receive the latest news and updates from our team.