
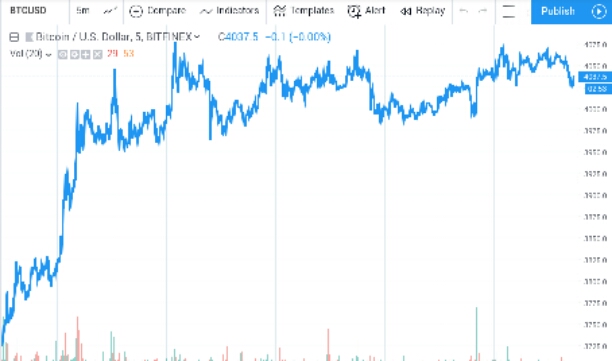
The past week has seen Bitcoin taking a remarkable bullish rally against the US dollar by 7%, as the price moved from 3,725 USD to the current 4,037 USD.
Before we lose ourselves into further details, let’s consider a few take home points.
- The past five days have seen Bitcoin making another encouraging improvement by 7%.
- The current price-trend momentum and indicators point to a continuing general sideways trend.
- Now might be a good time to let the price run its course before making any move as it may embark on another bull rally.
Bitcoin started out on the 18th oscillating at around 3725 USD and started setting new highs and lows in a bullish direction over a period of 12 hours. Upon reaching 12 noon on the 18th, the cryptocurrency embarked on a steep bullish trend which saw it exceed the 4000 USD mark as the next day begun. By 1 am on the 19th, the price had hit 4045 USD thus raising hopes of a 2019 major bullish rally largely fancied by the cryptocurrency community. The next 12 hours saw the price consolidating around the 3900-4000 USDT range before engaging on another short term upward trend which took it to the weeks high at around 4073 USDT.This was followed by a quick reversal which took the price back to the 3900 USDT vicinity by the 20th. After this, the price made another rebound which saw it take a sideways trend, oscillating within the 3980-4050 USD range.
The current price comes in as part of the recent trend revolving around the 64000 USD mark. According to the above chart, the past 24 hours have seen the price making a rather mild gain of 0.4% as the price moved from around 4022 USD to the current price. The 24-hr low was 3992 USD while the 24-hour high was 4075 USD.
INDICATORS
BOLLINGER BANDS
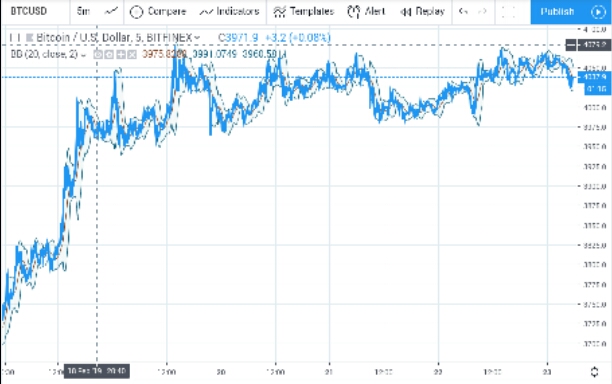
The Bollinger bands have been demonstrating a period of low volatility marked by a relatively uniform trend since the 21st. Currently, the price trendline is approaching the midline in a gradual bullish direction. Prior to the 19th, the chart shows a series of high and low volatility periods consistent with price changes, with the greatest divergence seen during the sharp bullish rally witnessed on the 18-19th. From the look of things, there seems to be not much to warrant any expectation of a major trend in a few hours to come. It seems we are still in a consolidation period around the 4000 USDT mark. However, the frequent upward movements might be a good sign against any possible bearish motion.
RELATIVE STRENGTH INDEX
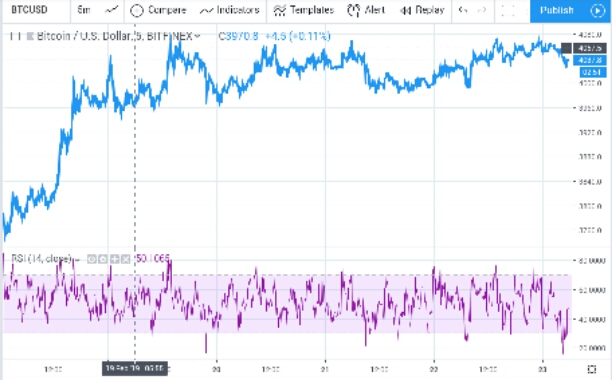
The Relative Strength Index trendline is currently lingering around the midline at 50.0000 in an upward trend from previous overbought conditions attained a few hours ago. The trend has lost momentum as the line is beginning to take a sideways direction in the midrange. The 22nd saw the trendline mainly oscillate in the mid range position as it approached the upper limit twice to reflect the upward tendency of the the trendline. Prior to this, there were three major events relating to the indicator, where the RSI line showed oversold and overbought conditions when the price hit the weeks high and low respectively. In general, the slowing momentum within the midrange indicates for a possible maintenance of the current general sideways trend. Otherwise, the trend might continue on the current bullish rally.
MOVING AVERAGE CONVERGENCE DIVERGENCE (MACD)
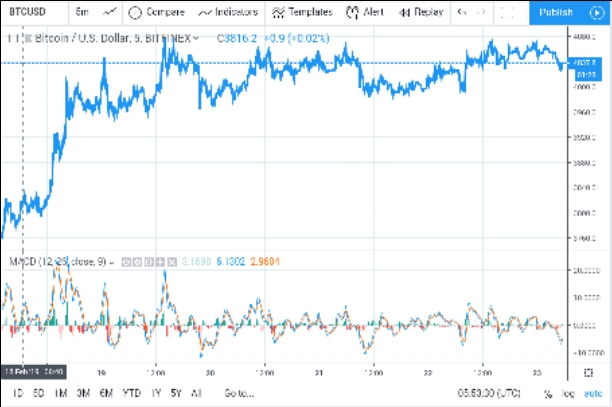
The Faster Moving average has taken a sharp turn bull-wards as the Slower Moving Average follows the lead. Upon narrowing on the previous crossover, the histogram is also responding as it is widening in a bullish direction. Before today’s reversal, the charts are showing a number of upward and downward crossovers consistent with the sideways trend which has been oscillating within the 3900 to 4050 range. From the look of things, it seems the MACD is pointing to a short term bullish trend, which is most likely part of the continuing sideways trend we’ve seen the past 2 days. If the price doesn’t settle for that, the trendline’s tendency towards upward direction means that we are more likely to see the price taking another bullish movement.
Stochastic RSI
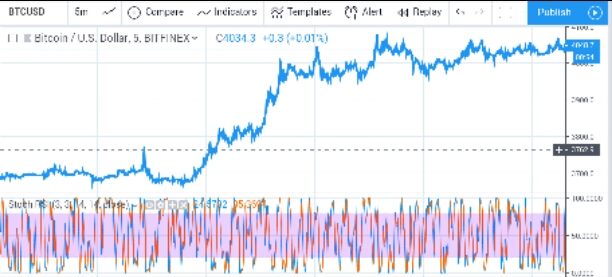
Like the MACD, both lines have taken a sharp rebound from overbought conditions and are losing momentum in the midline. Before today, the indicator has demonstrated multiple rebounds from overbought and oversold conditions consistent with multiple short term upward and downward reversals. In general, the indicator concurs with the MACD and RSI in pointing to a continuing sideways trend with an upward bias, which is a reason good enough for traders to stay put as they observe the cryptocurrency’s next move.