
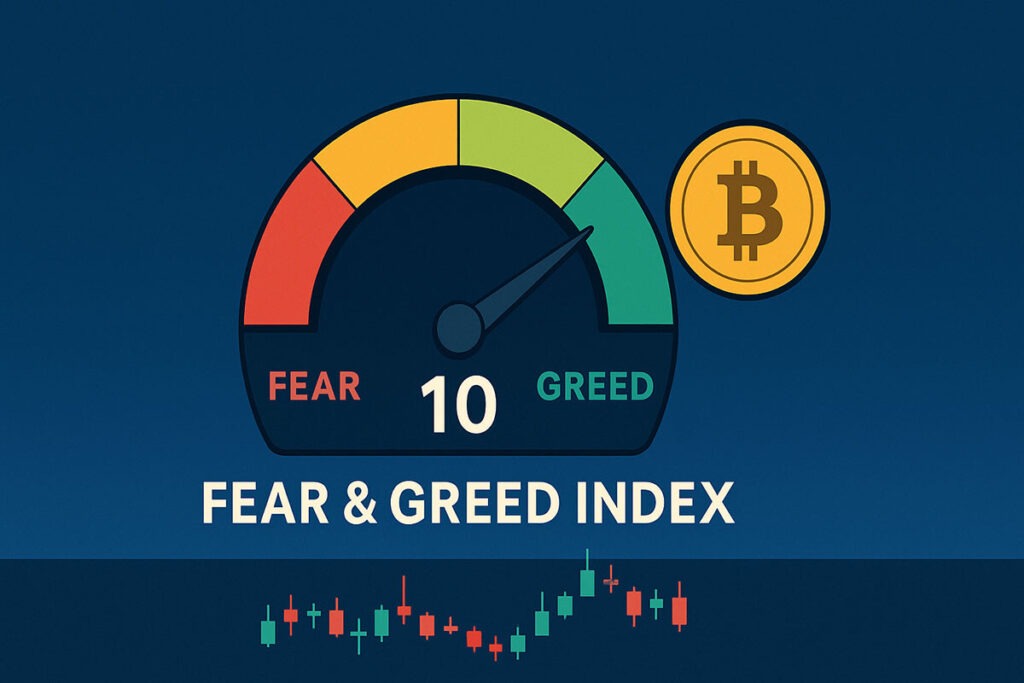
- Bitcoin sentiment index falls to 10 out of 100, matching levels seen during the COVID crash and the FTX failure.
- Market data shows ETF outflows and thinner order books, while traders reduce risk and close many leveraged positions.
- Conditions reflect clustered volatility and forced selling, with outcomes hinging on ETF flows and central bank policy in the coming months.
Extreme fear has returned to the crypto market. The Crypto Fear & Greed Index has dropped to 10 out of 100, a reading that usually appears only around major stress points such as the March 2020 COVID crash, the November 2022 FTX breakdown and the sharp correction in February this year. At the same time, Bitcoin has fallen from an all-time high above $126,000 in early October to lows near $93,000 in mid-November, erasing its year-to-date gains and pushing the market mood to one of the darkest levels in recent years. This combination of a rare sentiment reading and a deep price drawdown raises a practical question. Traders want to know whether the current fear level marks the start of a prolonged deleveraging phase or defines a value zone where long-horizon buyers quietly add exposure to Bitcoin while short-term positions are still unwinding.
Bitcoin fear index at 10 and what it reflects
The Crypto Fear & Greed Index compresses several market indicators into one number between 0 and 100, where lower values indicate fear and higher values indicate greed. The original version created by Alternative.me assigns 25% of the score to volatility, 25% to market momentum and volume, and the remainder to a mix of social media activity, Bitcoin dominance, Google Trends data and sentiment surveys. A reading of 10 sits close to the lower boundary of the “Extreme Fear” band, which covers scores from 0 to 24 and historically coincides with periods of very stressed positioning. Several providers now maintain their own versions of this index. CoinMarketCap, CoinGlass and other data firms publish daily sentiment gauges that use similar inputs and reach similar conclusions.

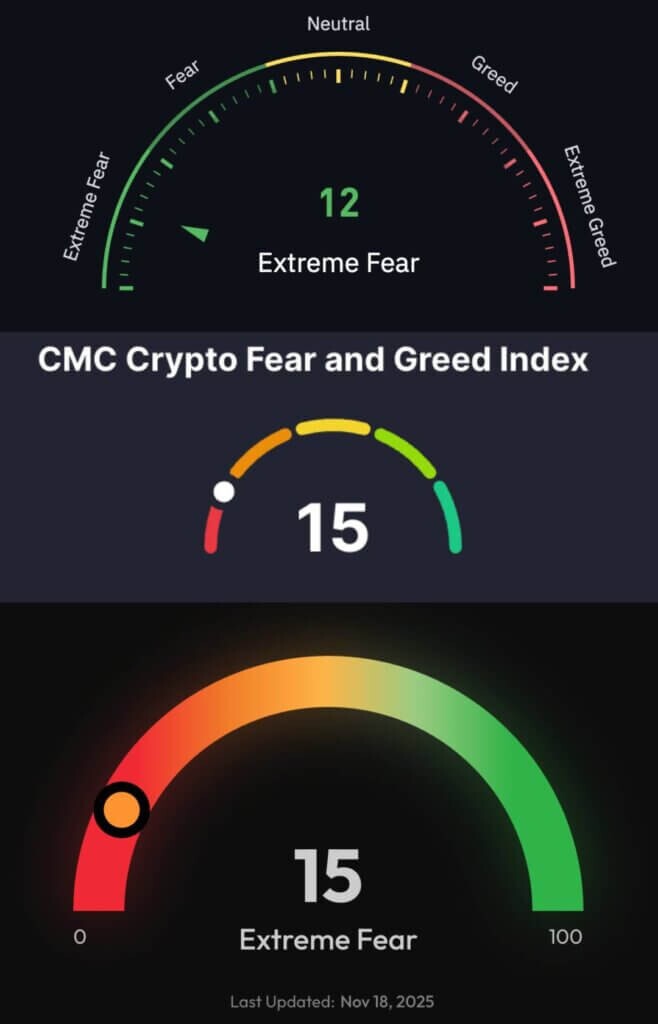
Despite differences in methodology, they now align on one point: the current environment sits firmly in deep fear, after a multi-week shift from neutral and greedy readings seen during the run to record prices in early October. A key feature of the index lies in its design as a contrarian barometer rather than a trading system. The index’s creators present it as a way to summarise crowd mood, not as a signal that tells traders when to buy or sell Bitcoin. They repeatedly stress that extreme fear can indicate a potential opportunity because many participants may be overreacting, and extreme greed often appears near overextended rallies. However, the evidence shows that the index does not time exact turning points; instead it tends to form clusters around broader value zones where long-term entries have worked in the past. Historical readings underline this point. In March 2020, during the COVID panic, the index printed a value in the single digits while Bitcoin briefly traded around $4,000 after dropping roughly 50% in two days. The reading captured capitulation-level fear but the durable bottom formed only after central banks delivered aggressive rate cuts and large-scale liquidity support. In November 2022, after the FTX collapse, the index sank to the low teens while Bitcoin hovered in the mid-$15,000s. The sentiment low and the price low did not occur on the same day. Instead, the index stayed in fear territory for weeks while the market digested the loss of a major exchange, and the next sustained advance developed only as structural demand from spot Bitcoin ETFs emerged in early 2024. Today’s reading of 10 follows a similar pattern. It signals that traders feel stressed and liquidity is thin, but it does not guarantee that the market already printed a durable low. It offers a snapshot of mood that needs to be read alongside information on flows, leverage and macro policy.
Bitcoin volatility clusters, forced selling and liquidity stress
The index rarely bottoms on a single sharp down day. It tends to reach its lowest values during volatility clusters, when several large moves arrive in close succession. Academic work on cryptocurrency markets confirms the presence of volatility clustering: periods of high realised volatility often follow one another, and extreme sentiment readings tend to align with these bursts of activity rather than with calm trading ranges. The current drawdown illustrates that pattern. The first shock came in October, when a surprise announcement of 100% tariffs on Chinese imports triggered the largest liquidation event in crypto history. Over a 24-hour window around October 10–11, more than $19 billion in leveraged positions were closed across exchanges, affecting roughly 1.6 million traders and driving a sharp intraday fall in Bitcoin from levels above $120,000 to lows around $105,000–$110,000, depending on the venue. The scale of that event exceeded both the March 2020 crash and the November 2022 FTX liquidation wave by an order of magnitude. Despite the intensity of that October move, the Fear & Greed Index did not drop into its deepest band at that time; it hovered near 25, marking fear but not yet extreme fear. The reason becomes clear when we look at the following weeks. After the initial liquidation shock, the market continued to grind lower. Liquidity in order books thinned, and the depth for Bitcoin on major exchanges fell from around $766 million in early October to roughly $535 million by mid-November, which made each new sell order more impactful and increased the chance of further forced liquidations. The latest leg came when Bitcoin slipped back to the $93,000 area in mid-November, wiping out all 2025 gains and pushing several technical indicators such as the daily RSI into oversold territory for the first time since the FTX bear-market lows. During that slide, forced unwinds exceeded $1.1 billion on one day and crossed $1 billion on several others, with long positions bearing most of the damage. These repeated liquidation waves created the environment in which the index finally reached 10. The reading does not arise from one sudden drop, but from a sustained period of heavy trading, thinner liquidity and ongoing deleveraging. It helps to distinguish between liquidity-driven bottoms and sentiment-driven extremes. Liquidity-driven lows form when flows force the issue: margin calls exhaust sellers, risk systems finish de-levering, central banks or policymakers signal support, or new structural buyers appear. Sentiment extremes show where collective fear or greed peaks, but they do not always mark the exact moment when the last forced seller exits. In March 2020 the liquidity bottom aligned with largescale policy support. In late 2022 the floor formed only after months of slow repair, as insolvent balance sheets were cleared and spot ETF demand arrived. The current situation shows a mixture of both forces. Liquidations have already reset a large portion of leveraged positioning, yet order book depth remains below early-October levels. Institutions hedge more aggressively, and short-dated options activity has increased as traders try to protect portfolios against further swings. The fear index captures how this environment feels to market participants. It does not tell us whether the next move in Bitcoin will be a fast rebound or another leg lower before conditions stabilise.
Bitcoin ETFs, flows and the role of macro policy
Sentiment alone does not explain why Bitcoin dropped more than 25% from its October peak near $126,000 to the recent lows around $93,000. Flows from large vehicles such as spot ETFs and macro policy shifts from the Federal Reserve now play a central role in price formation. In early 2025, spot Bitcoin ETFs provided a strong source of structural demand. Net inflows helped absorb both miner supply and some speculative selling. Throughout the first half of the year, this persistent buying supported the trend that carried prices to new highs. Recently the picture changed. Over the last several weeks, US-listed spot Bitcoin ETFs have seen sustained redemptions. Cumulative outflows have reached more than $2.3 billion, and on November 13 alone net redemptions totalled about $866 million, the second-largest daily outflow since these products launched in early 2024. When these vehicles sell, they convert investor fear into direct market pressure. ETF market makers either reduce hedges in futures or sell spot holdings, which adds to selling from liquidating leveraged longs. This helps explain why Bitcoin responded so strongly to the October liquidation cascade and the November drop below $94,000, even though macro data did not deteriorate as sharply as during previous crises. Federal Reserve policy provides the second key axis. The Fed restarted its easing cycle in September and followed up with another 25-basis-point cut in October. Markets currently expect another quarter-point cut at the December FOMC meeting, and some forecasts point to further reductions in 2026 if inflation continues to move toward target. Lower policy rates usually support duration-sensitive assets, which include growth equities and Bitcoin, because discounted cash-flow models and risk premia shift in their favour. However, the present fear reading suggests that traders worry more about the reasons behind the cuts than about the cuts themselves. Concerns over weaker growth, trade frictions and a recent government funding standoff have pushed investors toward safe assets such as cash and gold, which now outperform Bitcoin on a year-to-date basis. While the index signals capitulation-like sentiment, ETF outflows and cautious macro positioning show that some large investors still prefer to reduce exposure rather than buy into weakness. This tension defines the near-term outlook. If ETF flows stabilise around the December Fed meeting and any further tariff or policy headlines ease, then current extreme fear could mark a broad value zone for long-term allocations to Bitcoin. If redemptions from funds continue and macro uncertainty persists even as policy rates fall, the market may still be in the middle of a more extended deleveraging process where fear lingers and price ranges stay volatile before a clearer base forms.
Long-term BTC investors, extreme fear and return patterns
Research on sentiment indicators paints a nuanced picture. Several studies find that including the Fear & Greed Index improves volatility forecasts and helps explain periods when assets move more in sync, especially during episodes of extreme fear or greed. One 2024 paper reports a U-shaped relationship between the index and price synchronicity: both very low and very high readings correspond to more herd-like trading, while moderate readings align with more differentiated moves across assets. Other work finds that the index alone shows little consistent power for predicting future returns over short horizons. What appears more robust is the link between extreme fear and medium-term value zones. In March 2020 the index printed 8 as Bitcoin traded around $4,000. From that area, long-term holders who bought and held through volatility saw prices climb to $60,000 by early 2021. In late 2022 the index sat near 12 while Bitcoin consolidated around $16,000; investors with multi-year horizons who entered then later watched the asset pass $70,000 by March 2024 and reach above $100,000 by October 2024. These examples do not show precise bottoms, but they highlight that persistent extreme fear has often overlapped with points where long-term risk-reward looked more favourable than it did at euphoric peaks. The current reading of 10 fits that pattern without guaranteeing the same outcome. From its October 2025 high above $126,000, Bitcoin has declined roughly 25% to trade in the low-$90,000s, with local lows around $93,000 and intraday tests slightly below $94,000 across major exchanges. The crypto market as a whole has lost about $1.1 trillion in value over roughly six weeks, and analysts estimate that average daily drawdowns during this window reached around $27 billion. For patient investors, such conditions often mark the stage where time horizon becomes the key differentiator. Short-term traders still face elevated volatility, thin liquidity and unstable funding markets. Long-term allocators, by contrast, focus less on whether the index moves from 10 to 8 or back to 15 and more on whether leverage has cleared, ETF flows show signs of stabilising and macro policy shifts support risk assets over the coming years.History suggests that when sentiment indicators sit in deep fear while forced sellers still unwind, the path out of the zone can be slow and uneven. Prices may grind sideways, revisit lows or create false breaks before a new uptrend gains traction. For Bitcoin this often means that the most attractive opportunities emerge when headlines feel uncomfortable, not when the index has already climbed back into neutral territory and confidence has returned.
Conclusion
Extreme fear at a level of 10 captures how stressed the current market feels, but it does not act as a simple buy signal for Bitcoin. The index describes psychology, while liquidity, leverage and policy decisions shape the mechanics of price formation. Recent events underline this gap. A record liquidation cascade of more than $19 billion in October, followed by further billion-dollar unwinds in November and steady ETF outflows, has pushed prices from record highs above $126,000 down to the mid-$90,000s and briefly to around $93,000. Comparisons with March 2020 and late 2022 show that similar fear readings have aligned with broad value zones that rewarded long-term holders, but they also show that markets often need time to repair balance sheets and rebuild confidence after major shocks. The combination that matters is sentiment capitulation together with signs that liquidity stress has eased, leverage has reset and structural demand sources such as ETFs or corporate buyers have returned. Until those elements line up, the index reading at 10 tells us that traders feel anxious and that positioning is fragile, not that the exact bottom for Bitcoin already sits behind us.
Disclaimer
The information provided in this article is for informational purposes only and should not be considered financial advice. The article does not offer sufficient information to make investment decisions, nor does it constitute an offer, recommendation, or solicitation to buy or sell any financial instrument. The content is opinion of the author and does not reflect any view or suggestion or any kind of advise from CryptoNewsBytes.com. The author declares he does not hold any of the above mentioned tokens or received any incentive from any company.
Featured image created by AI


Subscribe To Our Newsletter
Join our mailing list to receive the latest news and updates from our team.