Ada Cardano has registered a 14 % hike against Tether (USDT) over the past week, as its price moved from 0.04064 USDT to the current 0.04672 USDT.
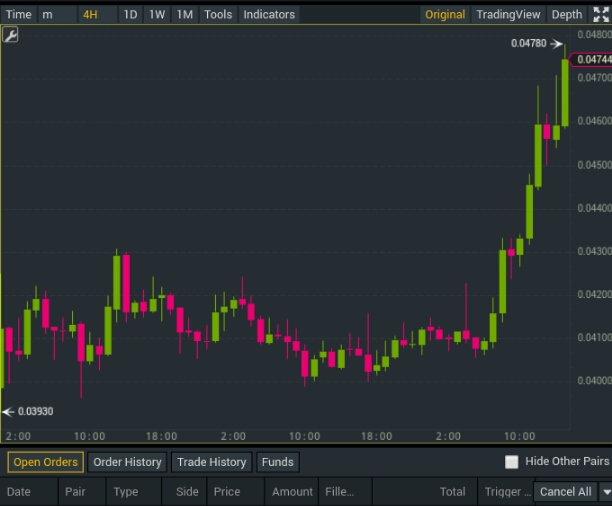
The cryptocurrency commenced the week in a modest way as its price was on a downward spiral by 2 am (CAT) on the 12th. However, fears of a continued bearish trend were thrown out the window when the price made a short term reversal to embark on a relative lateral trend, which was sustained untill the 17th at around 10 pm (CAT). The price plunged to the week’s low on the 14th when it hit 0.03990 USDT, before rebounding to resume the sideways trend. On the 17th, the price took a strong bullish rally which was sustained untill today (19th) when it hit the week’s high (0.04785) at around 6 am. Since then, the price has engaged on a short term bearish reversal which has taken it to the current price tag.
In terms of the past 24 hours, the price has gone through an 8.35% change, hitting a 24-hour high and low of 0.04785 USDT and 0.04267 USDT respectively. The 24 hour volume currently lingers at around 12.3 million USDT. Now let us take a look at the major talking points.
TAKE-HOME POINTS
- Ada Cardano hasn’t been spared from the bull ride taken by most top cryptocurrencies.
- Major indicators remain optimistic
- It’s a waiting moment for those who bought-in before the bull rally.
INDICATORS
BOLLINGER
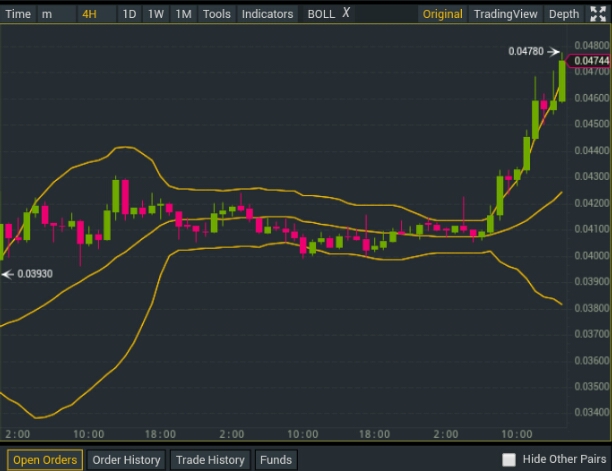
The Bollinger Bands are now exhibiting remarkable divergence as the price trendline maintains its position within the vicinity of the upper band. The phenomenon started on the 17th as the price took a sharp bullish turn after roughly 5 days of dominant sideways activity. This indicates for a possible continuation of the bullish trend in the strongest terms.
RELATIVE STRENGTH INDEX (RSI)
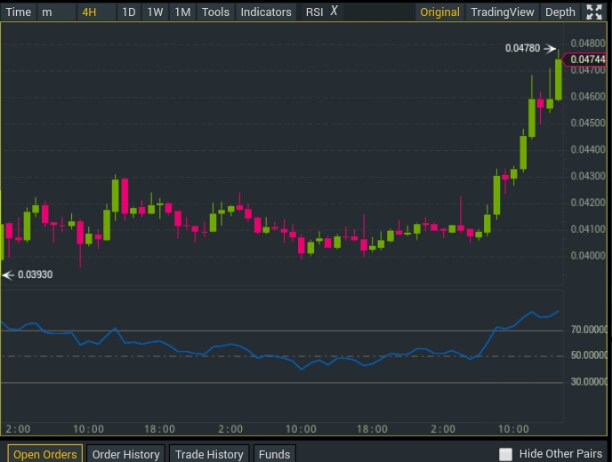
The RSI trendline is currently in the oversold zone while retaining its upward direction. Like the Bollinger Bands, it embarked on the bullish trend on the 17th as the price took the same direction. Prior to this, the RSI maintained its position around the midline since the 12th except for the 14th when the price hit the weeks low. In general terms, the RSI agrees emphatically with the Bollinger Bands that the bullish trend is likely to continue, with the worst case scenario being a consolidation at the newly established level.
MOVING AVERAGE CONVERGENCE DIVERGENCE (MACD)
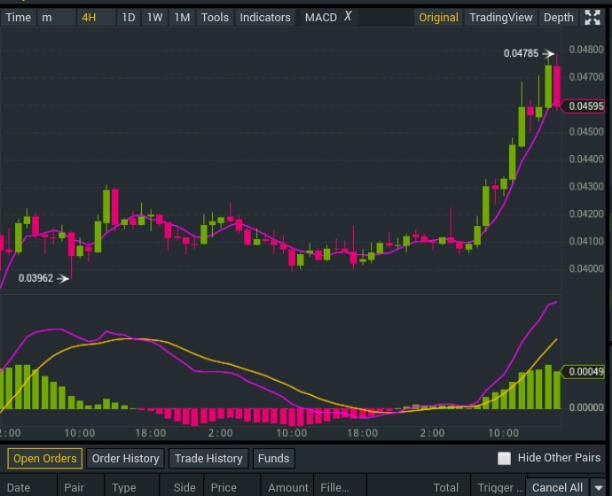
The faster and slower moving averages have been exhibiting increasing divergence since the 17th. The histogram has also been widening markedly. This was preceded by a period of marked convergence and a relatively flattened histogram since the 12th. With the current setup of the moving averages, there is little to suggest an imminent reversal thus concurring with the previous two indicators in suggesting a continuation of the current trend.
StochRSI
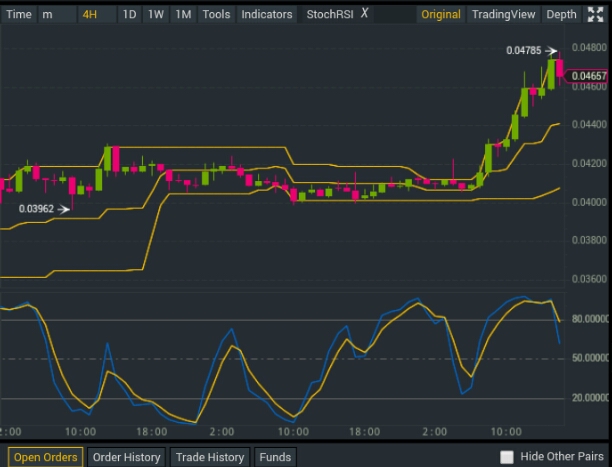
The StochRSI indicator is somehow suggesting something slightly different. After lingering in the oversold zone for a few hours, the two lines are now heading downwards. The oversold conditions were preceeded by previous overbought conditions on the 17th, and previous oversold and overbought events consistent with the price movements since the 12. In general, the StochRSI are suggesting a possible consolidation, which serves as a worthy caution to those overly excited by the recent strong bullish trend.
Disclaimer : “The views and opinions expressed here are solely those of the author and do not necessarily reflect the views of cryptonewsbytes.com. This article is not intended to provide any investment advice and should not be taken as is. Please perform your own research before investing in any cryptocurrency.”