
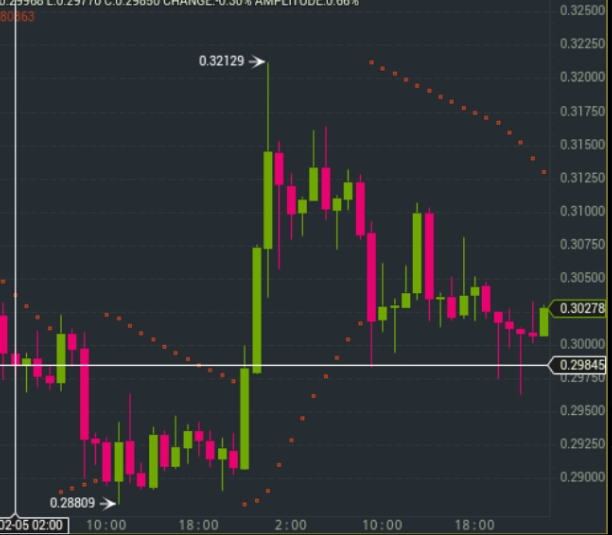
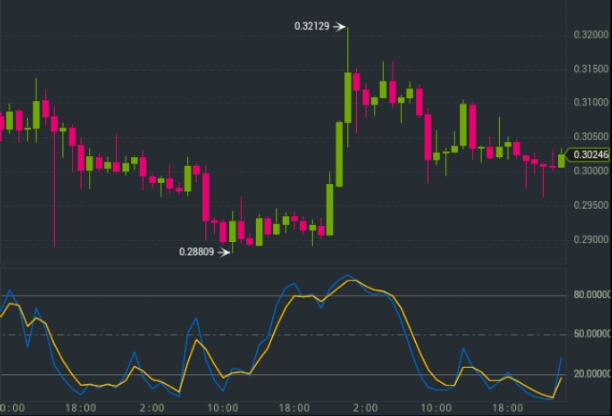
The past seven days have seen Ripple’s price against Tether (USDT) improve by 0.4% (0.29845-0.30278 USDT), as the price went through two major dramatic bearish and bullish reversals at the beginning and towards the end of the week. The price started out oscillating around 0.2985 USDT mark on the 5th before taking a sharp bearish turn in the early hours of the 6th, which led it to the weeks low at 0.28809 USDT about 12 hours later.
Upon hitting the weeks low, the price maintained a relatively sideways trend until the 8th where it embarked on a sharp bullish rally which took it to the weeks high at 0.32129 USDT, about 8 hours later. The next two days saw the price establish a new low at around 0.3 USDT from where it has maintained a relatively lateral trend which has taken it to the current price at 0.30278 USDT.
Over the past 24 hours, the price has seen a rather modest -0.32% decline, as it oscillated between 24-hour highs and lows of 0.30512 and 0.29626 respectively. The 24 hour volume responded accordingly as it also went through a slight decline to settle at around 12.9 million USDT.
A LOOK AT THE INDICATORS
BOLLINGER BANDS
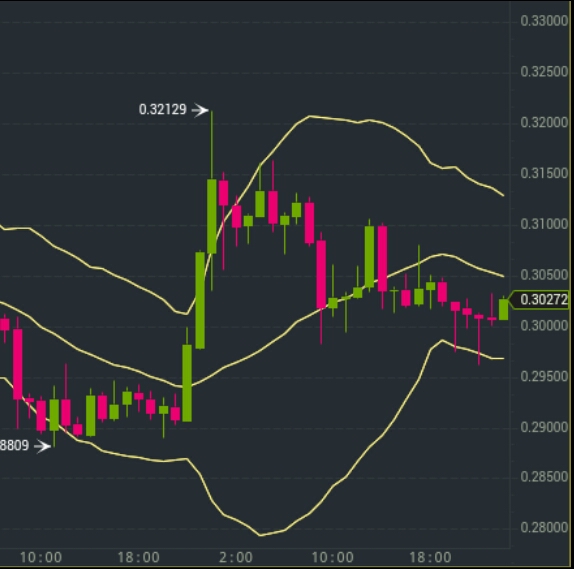
The Bollinger bands are showing two main distinct periods of low and high volatility marked by corresponding convergence and divergence. The period between the 5th and the 8th was characterized by low volatility, as demonstrated by the marked convergence by the chart above. As the price took a sharp reversal over the following 8 hours, the bands diverged significantly throughout the period to mark a period of heightened volatility. Currently, the bands are demonstrating mild convergence, as the trendline is approaching the midline of the bands amidst a generally lateral trend. From the look of things, there is no significant sign from the Bollinger Bands pointing to an imminent reversal or continuation of the downward trend. The positioning of the trendline within the bands, along with the increasing convergence shifts the possibilities towards a continuation of the current sideways trend.
RELATIVE STRENGTH INDEX (RSI)
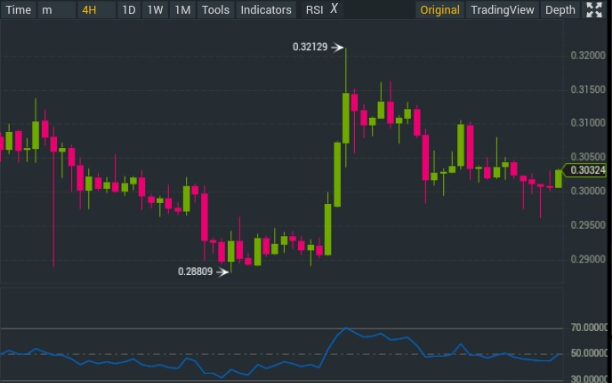
The relative strength index line started out on the 5th within the vicinity of the midline at 50.000, before descending towards the overbought zone where it touched the lower limit at 30.0000 when the price hit the weeks low. The RSI line followed the price on its bullish rally on the 8th to reach the oversold zone as the price hit the weeks weeks high. The line has also descended since then and now lingers within the vicinity of the midline. Like the Bollinger Bands, the current status of the RSI points to a possible continuation of the sideways trend.
Moving Average Convergence Divergence (MACD)
The two moving averages started out with marked convergence before the Faster Moving Average diverged as it went through a bearish rally to follow the price direction. Upon reaching the weeks low, the Faster Moving Average crossed over the Slower Moving Average to engage on a sharp bullish rally which saw the two lines exhibiting the weeks greatest bydivergence.
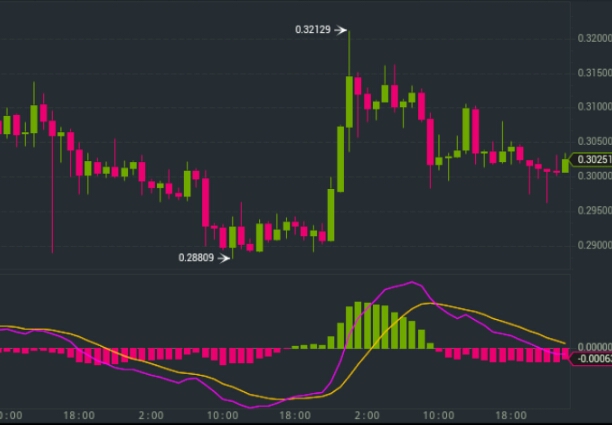
Another crossover took place as the price direction reversed to create an aftermath which exhibited a mild bearish divergence which has been sustained to the present. As of now, the faster moving average has taken a slight lateral turn which is consistent with what we’ve seen in the previous indicators. Although the moving averages are exhibiting mild divergence in a generally bearish direction, there also seems to be not much from the MACD to suggest an imminent strong trend in a bullish or bearish direction.
StochRSI
Both trendlines are currently emerging from the overbought zone to cross the lower limit at 20.0000. The overbought conditions have been sustained since the 10th when the sideways trend took shape. Prior to that, the trendlines hit the only oversold conditions of the week when the price hit the weeks high. Other significant events were seen on the 6th and 8th when overbought conditions were attained as the price went through the descent to hit the weeks low. The sharp turn taken by the two lines at the moment are somewhat indicating a possible upward reversal.
CONCLUSION
In general terms, Ripple has seen a slight improvement over the past week though the price movement has been rather volatile. Currently, there is little to suggest a possible strong trend in either direction as the indicators seem to point to a continuation of the current sideways trend.