
Ripple plummeted by 0.5% over the past week as the price tag moved from 0.31171 USDT to the current 0.313438 USDT.
QUICK TAKE HOME POINTS
- Ripple has seen a rather mild 0.5% decline over a highly volatile 5 day period.
- Major indicators are pointing towards a continued sideways trend commenced yesterday.
- This could be a good sell point for short term traders, as the price seems to be consolidating at a higher level after the recent spike.
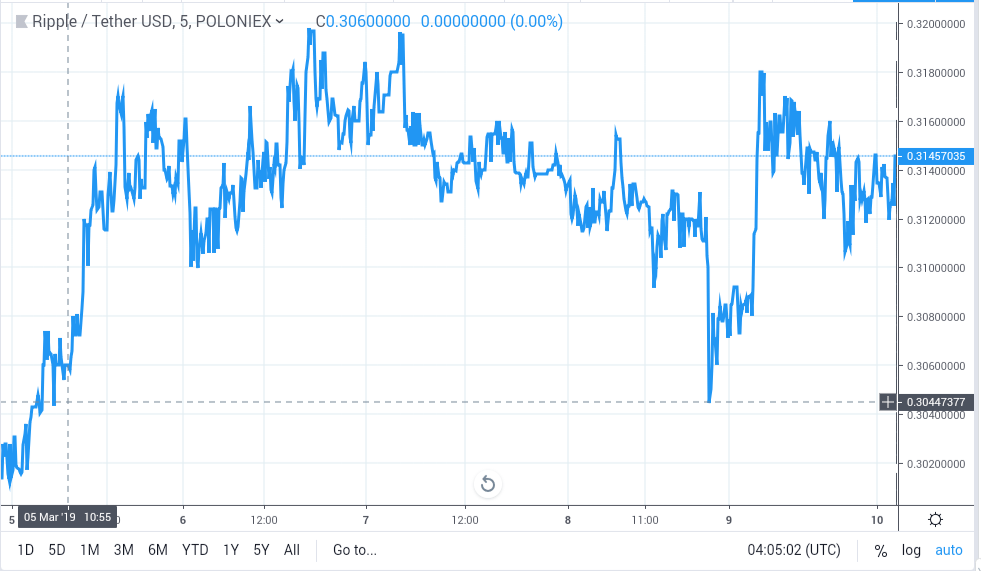
As demonstrated by the above graph from tradingview and adopted from Poloniex exchange, the price started out on the 4th from the above stated initial price, and went through a quick and strong bearish trend which took it to the week’s low ( 0.296999 USDT) in less than 12 hours. However, this proved to be nothing more than a short term trend as the trendline went through a quick reversal, which took the price above the initial rate to around 0.031725 USDT by 16:40 hours on the 5th.
A short term correction was later on followed by another quick bullish trend which saw the price achieving the week’s high at 0.31965 USDT on the 6th (16:55). Upon a quick reversal from the week’s high, the price failed to maintain a sideways trend and went through another bearish motion, which saw it hitting another marked low at around 0.30440 USDT yesterday by 22:00. This was followed by another volatile turn as the price went through a sharp 8 hour reversal. Over the past 24 hours, the price has been gradually setting new highs and lows in a bearish direction which has take it to the current price.
INDICATORS
Bollinger Bands
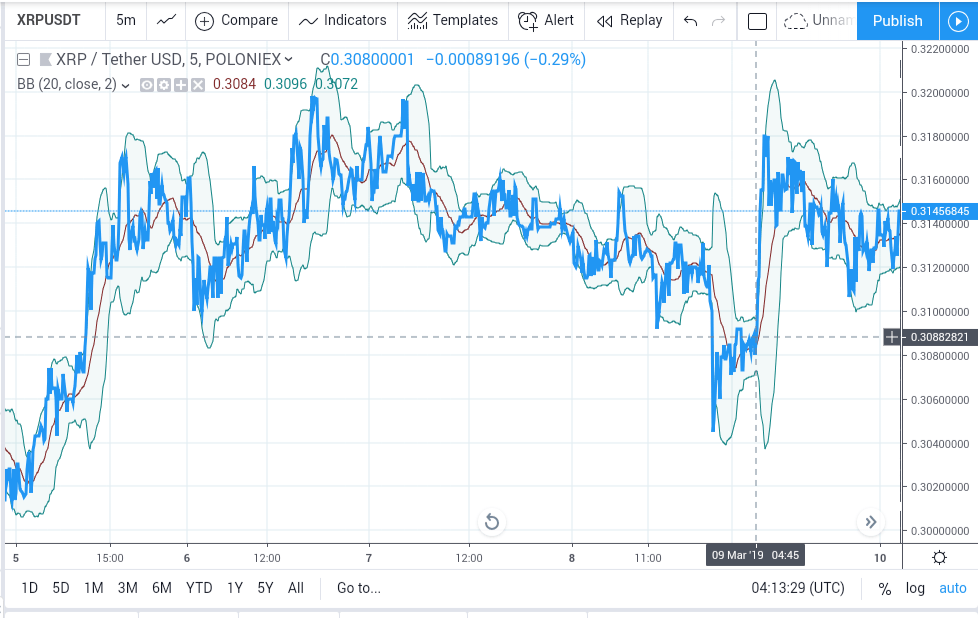
The Bollinger bands are currently exhibiting convergence, as an aftermath of a highly volatile period evidenced by the marked divergence which accompanied the volatile movements on the 8th and 9th. The trend line is now biased towards the upper band in a gradual motion towards the upper boundary. Prior to the 8th, the bands exhibit a number of high and low volatility periods consistent with varying price movements within the week. In general, the converging bands and gradual momentum of the price are pointing to a possible sideways trend over the next few hours.
Relative Strength Index
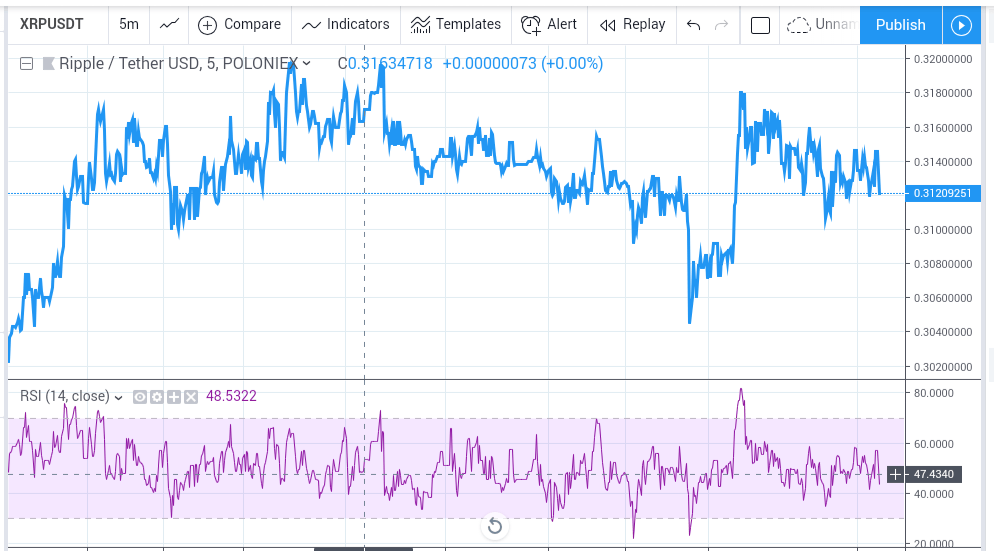
The RSI line is exhibiting a low momentum lateral trend around the midline at around 50.000, thus providing a classic indication of a sideways trend likely to continue in the next few (12-24) hours. This comes in as the aftermath of a spike which took it to the most recent oversold conditions on the 9th. Prior to this, other overbought and oversold conditions were met as the price moved through the week’s high and low and other pronounced spikes through the week.
Moving Average Convergence Divergence (MACD)
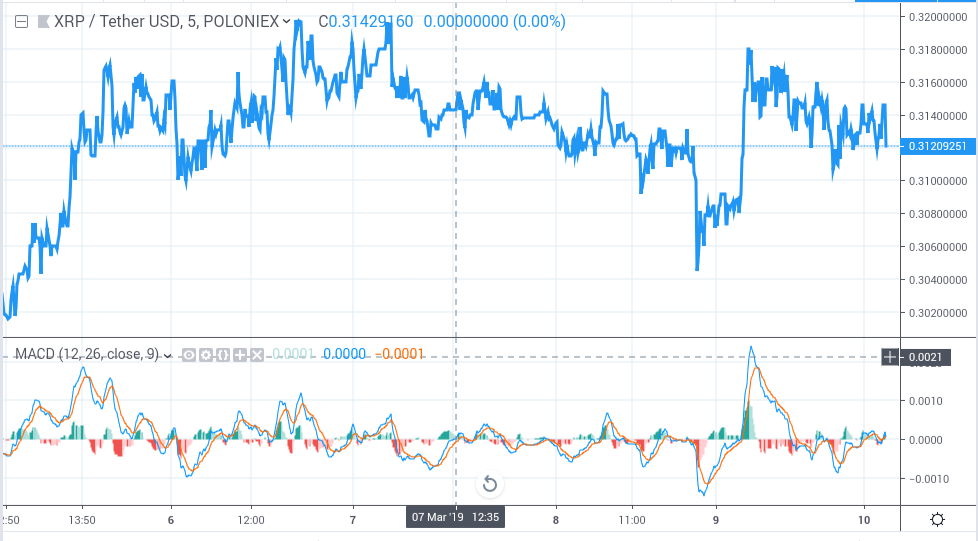
The two moving averages are now in the midrange, with the faster moving average exhibiting a gradual upward momentum while the histogram has siginificantly narrowed to a thread. Though this might be a good sign, the momentum is not enough to warrant any high expetations of an imminent strong bullish trend. It does however indicate for a continued sideways trend. Before the recent trend, a number of crossovers and changes in momentum are consistent with the volatile price movements throughout the week.
StochRSI
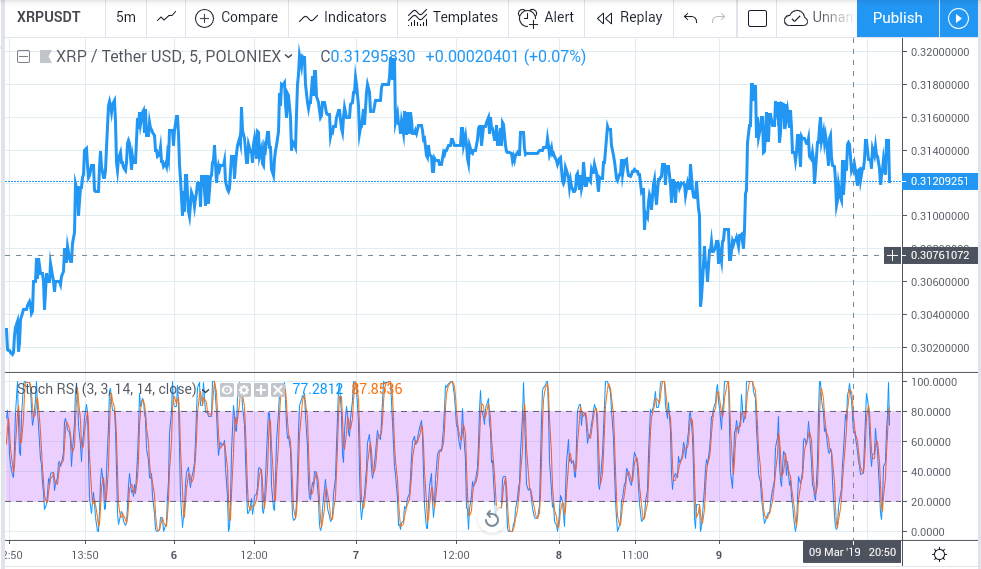
The StochRSI concurs with the Relative Strength Index as the two lines are demonstrating an affinity towards the mid region after hitting oversold conditions a few hours ago. As expected, the indicator demonstrates much more overbought and oversold conditions over the past week, which are consistent with the numerous turns associated with the price trend.