
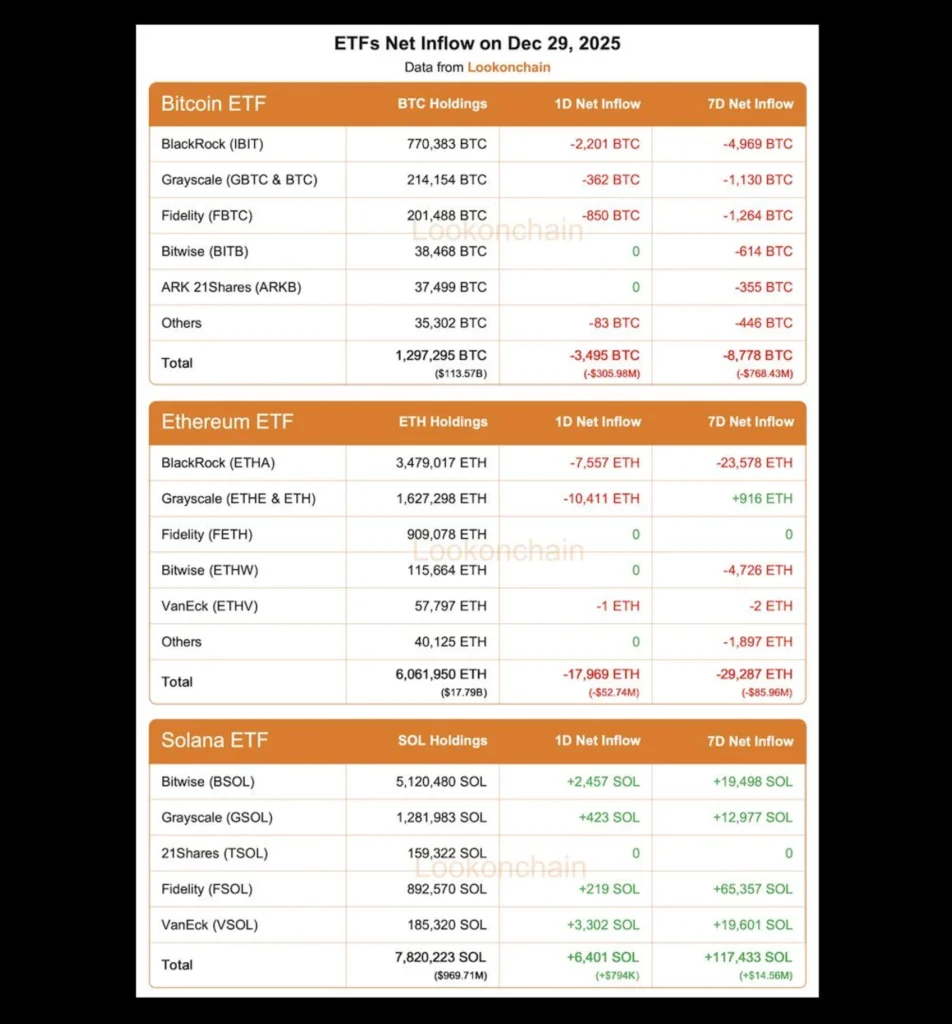
- Recent Solana ETF inflows passed Bitcoin and Ethereum over the last week, signaling a shift in capital toward faster, low-fee blockchains.
- SOL tracks key levels with 124 dollars as support and 190 dollars as a possible target, while indicators suggest weak but stabilizing momentum.
Solana’s recent performance in exchange-traded funds has drawn fresh attention from both institutional desks and active traders, and the Solana ETF segment now reflects that change in sentiment. Over the previous week, Solana ETF products recorded inflows that exceeded the combined net inflows into Bitcoin and Ethereum funds, a shift that hints at growing confidence in high-performance blockchains. Capital has rotated toward networks that can handle fast confirmation times and low fees, while still supporting active DeFi and on-chain use cases.

Solana’s high throughput, low transaction costs, and visible activity in applications give the network a position that investors can track through a Solana ETF instead of managing coins directly. At the same time, technical indicators on the underlying asset, including a key support area near 124 dollars and an upside target around 190 dollars, guide traders who try to align spot exposure, derivatives, and Solana ETF allocations with chart signals.
Solana ETF flows signal a rotation toward high-performance chains
During the last week of trading, data on fund flows showed that capital moving into Solana ETF products surpassed the new money entering both Bitcoin and Ethereum funds combined, which is a notable change in market behavior. Investors who once treated BTC and ETH as the main entry points now explore alternatives that can scale transactions and support a wide range of on-chain activity. The Solana network processes transactions with low fees and short confirmation times, which reduces friction for DeFi, non-fungible tokens, and other on-chain tools that need speed. That practical usage makes it easier for portfolio managers to justify a dedicated Solana ETF position rather than leaving the asset grouped with a mixed basket of smaller coins. The inflow pattern also shows an increase in risk appetite, because traders move beyond the two largest assets by market share and look at networks that still carry more technology and protocol risk. At the same time, recent improvements in Solana’s network stability and upgrades at the validator and client level have reduced the frequency of outages that once concerned many market participants. When those technical improvements meet steady demand from a Solana ETF, they help rebuild trust that the network can support higher volumes during active market phases without frequent disruption.
Solana ETF demand and the link to Solana’s technical structure
While Solana ETF flows look strong, traders still track the underlying chart to judge how sustainable the move may be, because fund units ultimately depend on SOL’s market price. On the daily chart, analysts such as Peak have pointed out a head and shoulders pattern that places the asset at a critical point for the short to medium term. The important area to watch sits around 124 dollars,

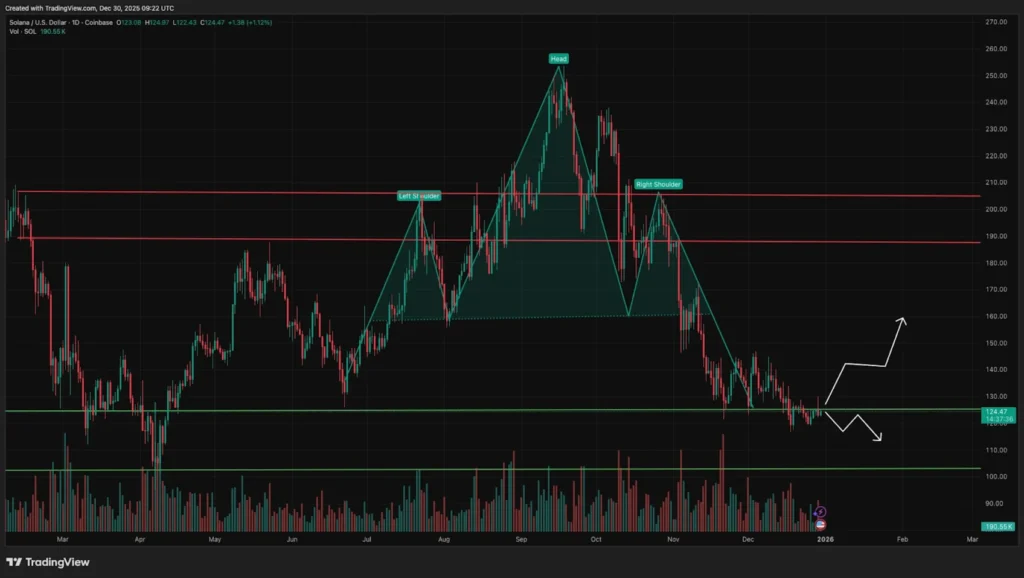
which has attracted buyers in earlier pullbacks and now acts as a support zone. If that 124-dollar level holds after retests, sellers may lose strength, and SOL can stage a relief move that lines up with renewed inflows into a Solana ETF. In that positive case, many traders see room for a push toward a technical target near 190 dollars, because that level follows from the height of the head and shoulders formation measured from the neckline. If price action instead breaks cleanly below 124 dollars with rising volume, the pattern confirms a bearish scenario in which the market accepts lower levels and some Solana ETF holders might rebalance or hedge. The structure therefore gives both ETF investors and derivatives traders concrete reference points rather than leaving them with vague expectations. A clear support, a defined upside target, and the pattern on the daily chart together frame how much risk each participant may want to take in direct SOL exposure versus a Solana ETF allocation.
Broader market context around Solana fund flows and on-chain activity
The weekly chart adds another layer for people who hold Solana ETF positions over longer periods and do not react to every intraday move. On that timeframe, SOL trades in a range with a slightly bearish tilt, which means price has not yet confirmed a strong new trend either upward or downward. The relative strength index sits near 43, below the midpoint of 50, so momentum remains weak but not yet deeply oversold. That reading shows that sellers still dominate slightly, yet they do not push the asset into an extreme condition.

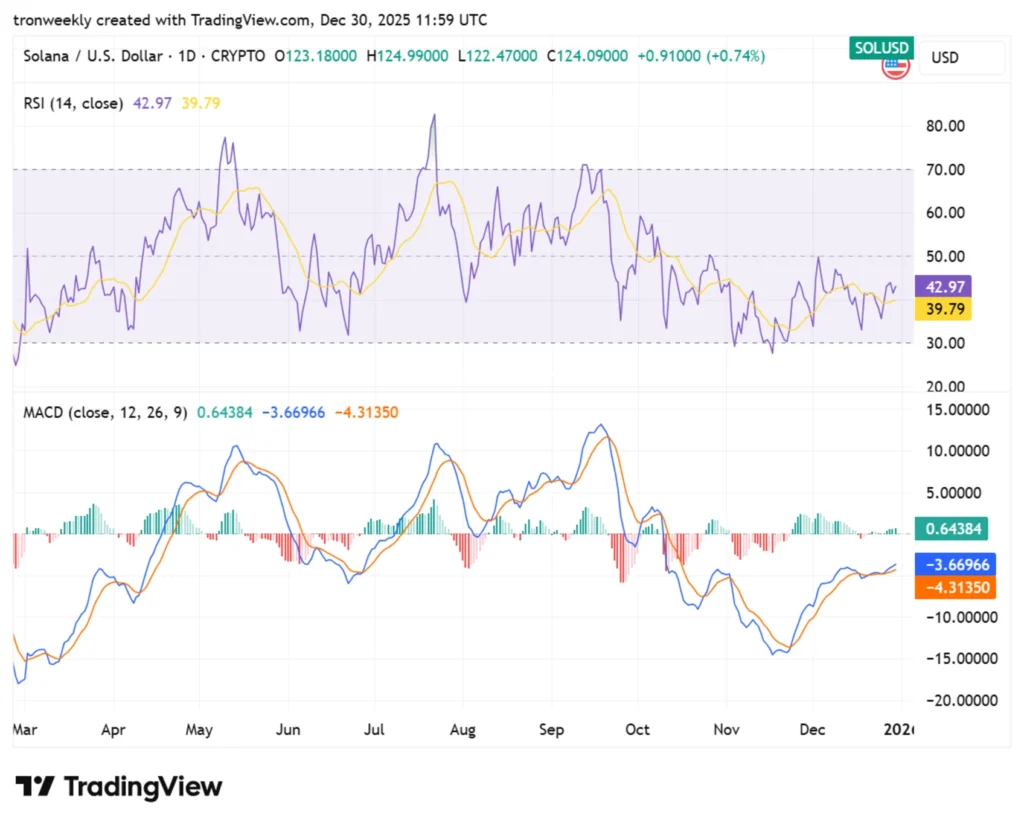
At the same time, the recent move up from lower levels on the chart suggests that the previous wave of selling pressure may be fading. When the market bounces from the bottom of the range while the RSI climbs gradually from 43, some medium-term investors view that as early stabilization rather than a final decision on direction. The moving average convergence divergence indicator remains below the zero line, which keeps the overall setup technically bearish, but the histogram has turned positive. That color change indicates that the downward momentum slows even if the main signal line still sits under zero. For a Solana ETF investor who reviews charts weekly, this combination hints that the market may consolidate before any larger move. In such a phase, steady inflows into a Solana ETF can reflect accumulation by investors who expect that once the range resolves, the network’s active DeFi ecosystem and low-fee structure will support higher valuations.
Risk profile, investor appetite, and what Solana ETF trends mean for crypto
Rising interest in Solana ETF products also says something about how investors view risk and opportunity in the broader crypto landscape. When flows favor a network like Solana over the most established names, it suggests that market participants accept higher protocol risk in exchange for potential growth in user activity and on-chain fees. Many DeFi teams continue to launch new tools on Solana because block times remain short and transaction costs stay low, which encourages experiments that might not be viable on slower or more expensive networks. Those applications create organic demand for block space, and a portion of that demand can translate into interest in a Solana ETF, because some institutional desks prefer regulated fund structures over direct custody of SOL. At the same time, inflows do not remove the structural risks that still exist. The network must maintain stability, avoid extended outages, and keep pushing client and validator improvements to prevent past issues from recurring. Technical traders will continue to monitor the 124-dollar support level and the possible 190-dollar upside target, since sharp breaks in either direction can affect how comfortable investors feel with exposure through a Solana ETF. The current indicators, including an RSI near 43 and a MACD line under zero but with a positive histogram, show a market that stabilizes rather than one that has already confirmed a major reversal. For now, the picture that emerges is a cautious but noticeable shift, where a section of the market reallocates from large-cap benchmarks into high-throughput networks that can show real usage.
Conclusion
Recent weeks have placed Solana and every Solana ETF in the spotlight, because fund flow data shows inflows that beat the combined totals for Bitcoin and Ethereum ETFs over the same period. That rotation highlights a search for networks that offer speed, low fees, and active on-chain ecosystems, while technical metrics such as the 124-dollar support zone, the 190-dollar target, the RSI reading near 43, and the MACD profile give traders specific levels to observe. Investors who use a Solana ETF gain a way to track that story through a regulated product while avoiding direct custody, but their results still depend on the network’s stability and the underlying market structure. As long as the chart maintains key supports and on-chain activity stays healthy, demand for Solana ETF exposure can remain part of a broader shift toward high-performance blockchains within the crypto market.
Disclaimer
The information provided in this article is for informational purposes only and should not be considered financial advice. The article does not offer sufficient information to make investment decisions, nor does it constitute an offer, recommendation, or solicitation to buy or sell any financial instrument. The content is opinion of the author and does not reflect any view or suggestion or any kind of advise from CryptoNewsBytes.com. The author declares he does not hold any of the above mentioned tokens or received any incentive from any company.
Featured image created by AI


Subscribe To Our Newsletter
Join our mailing list to receive the latest news and updates from our team.