

- This comprehensive article explores the Symmetrical Triangle pattern observed on the 4-hour chart of EGLD (MultiversX), indicating a potential breakout and providing detailed insights for traders and investors.
- By analyzing EGLD’s market dynamics, price targets, and the implications of the Symmetrical Triangle pattern, this article equips readers with valuable information to make informed decisions in the cryptocurrency market.
In this article, we will delve into EGLD (MultiversX) and analyze a significant technical pattern known as the Symmetrical Triangle. This pattern has caught our attention on the 4-hour chart, suggesting a potential breakout in the near future. By providing you with a comprehensive understanding of EGLD’s current market dynamics and price targets, we aim to empower you to make informed investment decisions.
Unveiling the Symmetrical Triangle Pattern
The Symmetrical Triangle pattern is a popular chart formation used in technical analysis. It is characterized by converging trendlines that connect a series of lower highs and higher lows, ultimately forming a triangle shape. This pattern indicates a period of consolidation, where the price range narrows, reflecting a balance between buying and selling pressure.
Anticipating EGLD’s Impending Breakout: Positioning for Profitable Opportunities
The Impending BreakoutBased on our analysis, we anticipate that EGLD is on the verge of a breakout from the Symmetrical Triangle pattern. As the price approaches the apex of the triangle, we expect a surge in trading volume and a subsequent directional movement. While the direction of the breakout is uncertain, we can position ourselves to take advantage of either scenario.
Price Targets for EGLD
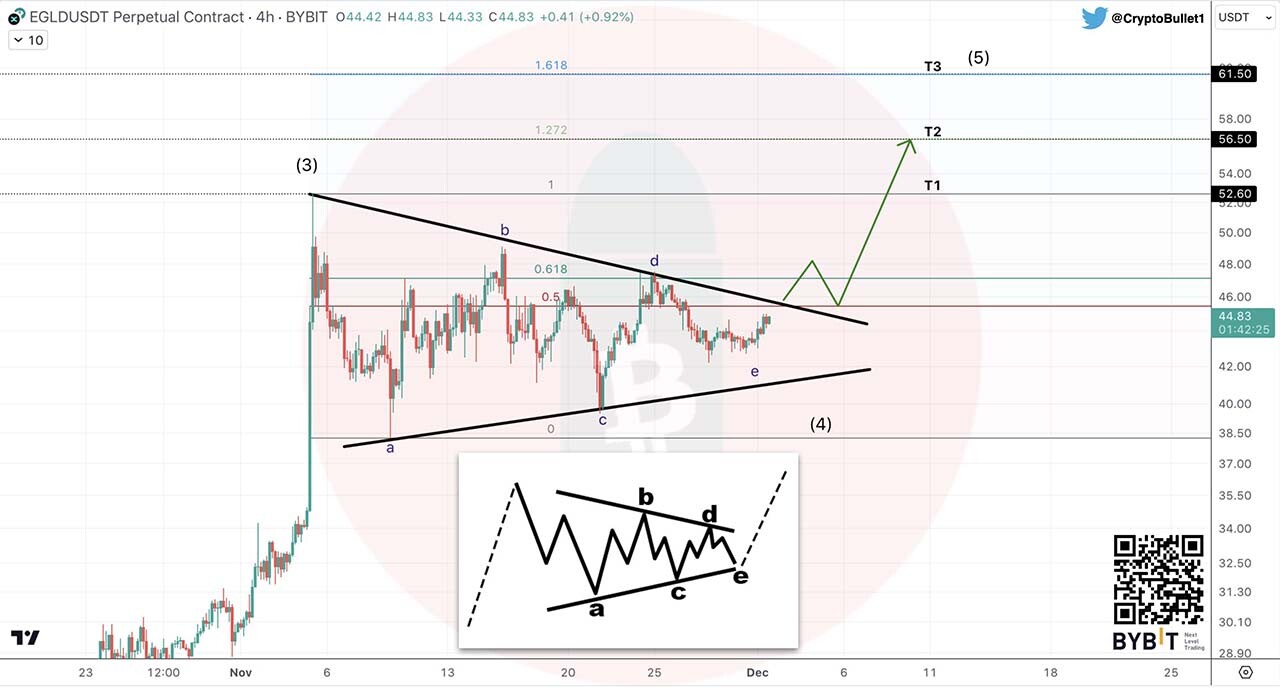
To provide you with potential price targets for EGLD, we have identified three levels that could play a crucial role in the upcoming price action:
- Target 1 (T1): $52.6 – If EGLD breaks out above the upper trendline of the Symmetrical Triangle, we anticipate a bullish move towards this initial target level. This represents an opportunity for traders to capture profits as the price rises.
- Target 2 (T2): $56.5 – Should EGLD’s bullish momentum persist, surpassing the first target, we expect the price to continue its ascent towards this higher level. Traders who enter positions at earlier stages may consider taking partial profits here.
- Target 3 (T3): $61.5 – In the event of a strong and sustained bull run, EGLD has the potential to reach this third target. Traders who are looking for more substantial gains may choose to hold their positions with a long-term perspective.
Conclusion
In conclusion, EGLD’s Symmetrical Triangle pattern on the 4-hour chart indicates an imminent breakout. By understanding the intricacies of this technical formation and having clear price targets in mind, investors can make well-informed decisions to capitalize on potential upward price movements. However, it is crucial to remember that market conditions can change rapidly, and it is always advisable to conduct thorough research and seek professional advice before making any investment decisions. Remember, the world of cryptocurrency trading carries inherent risks, and it is essential to exercise caution and employ risk management strategies to protect your capital.
Disclaimer
The information provided in this article is for informational purposes only and should not be considered financial advice. The article does not offer sufficient information to make investment decisions, nor does it constitute an offer, recommendation, or solicitation to buy or sell any financial instrument. The content is opinion of the author and does not reflect any view or suggestion or any kind of advise from cryptonewsbytes.com. The author declares he does not hold any of the above mentioned tokens or received any incentive from any company.
image source


