
- The crypto analyst provides insights into Litecoin’s market dynamics, indicators, and price chart.
- Key features include the significance of the SMA 200 indicator and the triangle formation.
- The article highlights Fibonacci retracement levels, resistance zones, and the buy zone for strategic trading.
In the ever-evolving landscape of cryptocurrency trading, having a comprehensive understanding of market dynamics is paramount for investors and traders alike. This weekly timeframe overview of Litecoin’s price chart, allowing us to delve into the cryptocurrency market’s behavior over an extended period. Each candlestick on this chart encapsulates a full week of price activity, providing a broader viewpoint compared to shorter-term charts.
Weekly Timeframe Overview
The Litecoin chart, set on a weekly timeframe, provides a holistic view of the market’s behavior over an extended period. Each candlestick on this chart encapsulates a full week of price activity, offering investors a broader perspective compared to daily or hourly charts. This approach is beneficial for identifying long-term trends and patterns in the cryptocurrency market.
Significance of the SMA 200 Indicator
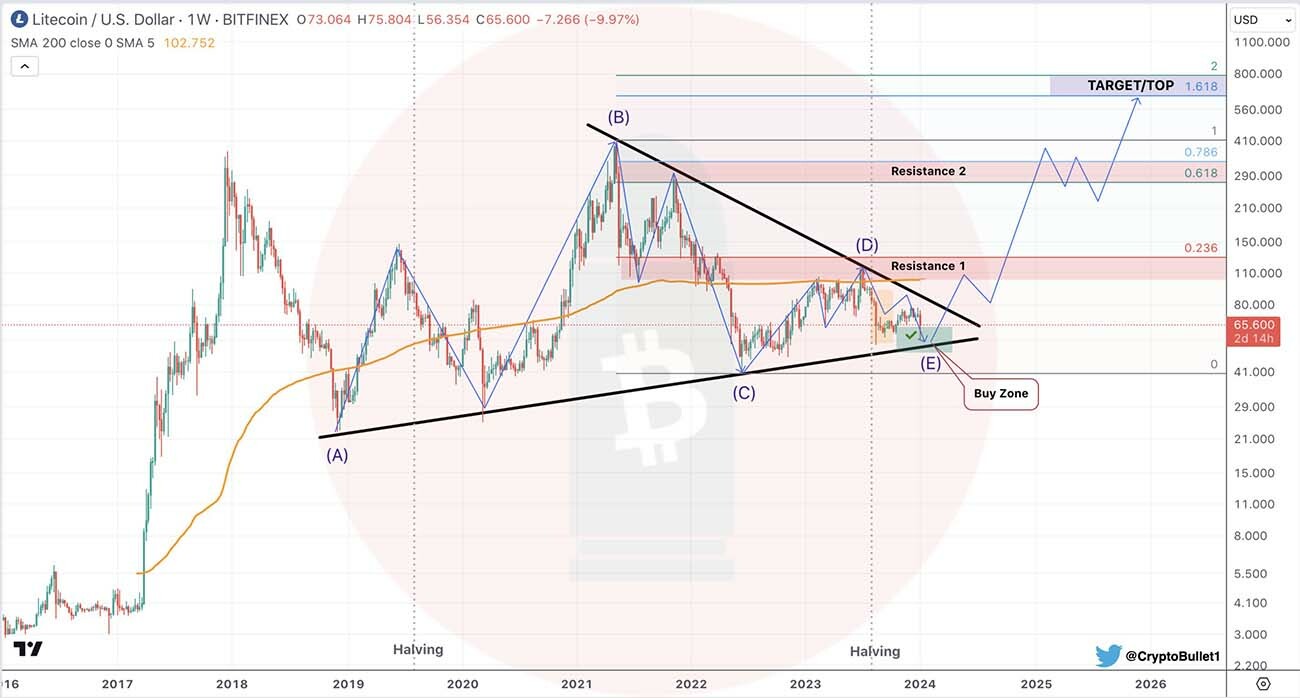
A key feature on this chart is the Simple Moving Average (SMA) 200, distinguished by its orange line. This indicator calculates the average closing price of Litecoin over the last 200 weeks, currently positioned at 102.752 USD. The SMA 200 serves as a critical benchmark for understanding market sentiment, often acting as a resistance or support level in trend analysis.
Triangle Formation and Price Action
The chart reveals a triangle formation, marked by converging trendlines (A), (B), (C), (D), and (E). This formation is a hallmark of continuation patterns in technical analysis, suggesting that a significant price breakout, either upwards or downwards, is imminent. Such patterns are pivotal for traders aiming to capitalize on potential market movements.
Application of Elliott Wave Theory
Elliott Wave Theory has been employed to decipher the price movements of Litecoin, with points (A) to (E) delineating the distinct phases of the pattern. The theory predicts an upward breakout following point (E), offering a strategic insight into future price trajectories based on historical wave patterns.
Fibonacci Retracement Levels: Key Predictors
Incorporated within the chart are Fibonacci retracement levels – 0.236, 0.618, 0.786, and 1. These levels, drawn as horizontal lines, represent potential support and resistance zones. They are crucial in predicting where the price might encounter barriers based on past market activity, thus guiding investment strategies.
Identifying Resistance Levels
Two critical resistance levels are highlighted above the current price, signifying areas where selling pressure previously prevailed. These levels are instrumental for traders to gauge potential price ceilings and make informed decisions about entry and exit points in their trading strategies.
Projected Target/Top with Elliott Wave and Fibonacci
A notable feature is the “TARGET/TOP” projection at the 1.618 Fibonacci level. This target is rooted in the synergies between Elliott Wave Theory and Fibonacci trading strategies, offering a quantifiable goal for traders leveraging these technical analysis tools.
The Buy Zone: A Strategic Entry Point
Beneath the current price, a designated “Buy Zone” suggests a favorable purchasing area. This recommendation is based on the chartist’s in-depth analysis and understanding of market dynamics, providing a strategic entry point for investors.
First Target at $300: A Critical Milestone
The Litecoin market is exhibiting signs that point towards a significant first target of $300. This target is not only a psychological barrier but also a pivotal technical level. Reaching this target would signify a robust bullish momentum, reflecting a substantial increase from current levels. It’s a key milestone that could potentially trigger further upward movements, as breaking such a significant level often attracts additional market interest and investment.
Second Target at $640: Doubling Down on Bullish Trends
Upon achieving the first target, the next ambitious goal for Litecoin is set at $640. This second target represents a doubling of the first milestone, indicating an even stronger confidence in the market’s bullish trend. Achieving this level would underscore the market’s resilience and potential for sustained growth, offering a promising outlook for long-term investors. This target is not only a testament to Litecoin’s market strength but also a signal for potential new highs in the future.
Impact of Litecoin Halving Events
The chart also denotes “Halving” events for Litecoin through two vertical dotted lines. These events, which reduce the block reward for miners by half, have significant implications on Litecoin’s supply and, consequently, its market price. Understanding these events is crucial for anticipating supply-induced price fluctuations.
Current Market Position: Litecoin’s Price
As of the chart’s latest update, Litecoin is trading at $65.600. This price point is essential for comparing with historical data and for making predictions about future market movements.
Conclusion
In conclusion, this article emphasizes the importance of understanding market dynamics in cryptocurrency trading. The weekly timeframe overview of Litecoin’s price chart provides a holistic view, while indicators like SMA 200 and patterns like the triangle formation offer strategic insights. Fibonacci retracement levels and resistance levels aid in predicting price movements, and the “Buy Zone” indicates a favorable entry point. Consideration of Litecoin halving events and the current market position is essential for analysis and predictions.
Disclaimer
The information provided in this article is for informational purposes only and should not be considered financial advice. The article does not offer sufficient information to make investment decisions, nor does it constitute an offer, recommendation, or solicitation to buy or sell any financial instrument. The content is opinion of the author and does not reflect any view or suggestion or any kind of advise from CryptoNewsBytes.com. The author declares he does not hold any of the above mentioned tokens or received any incentive from any company.