
This year, I am seeing Bitcoin at $51000 if, we get this confirmation. I will also share the validity of the theory I am proposing here. Bitcoin (BTC) is forming a right shoulder of the inverted Head & Shoulder. I explained this pattern last month, and predicted that Bitcoin will retrace from the Neckline of the pattern to form a right shoulder of the Bullish pattern.
This correction is just a small pullback to complete the pattern. In this article, I will share, how bitcoin (BTC) can hit $51000 by the end of this year.
Current Price Analysis of bitcoin (BTC)
Bitcoin (BTC) loses 5% of its value on Friday, BTC closes below the 50 daily moving average for the first time after two months. When prices are above the 50 daily moving average this means price action will be positive in the coming days and vice versa.
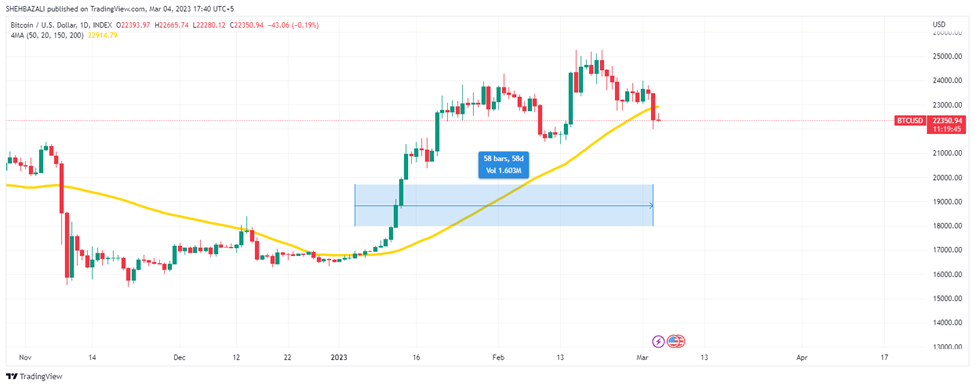
According to the data from Tradingview, Bitcoin (BTC) is trading at $22200. Today, the bitcoin is down 0.53 from its opening price.
Bitcoin (BTC) tested the Support level of $22000, there isn’t a big buying so far. But, sell pressure continuously pushes the bulls downside as the daily candle suggests. On a weekly time frame, 19670 will remain a major support for Bitcoin (BTC) in the coming weeks.
Bitcoin can hit $51000 by the end of this year
Technically, Bitcoin (BTC) is forming two famous bullish patterns, the Falling Wedge and inverted Head & Shoulder.
Bitcoin has successfully break-out the falling wedge with good volume, The two barriers that are stopping BTC to achieve the Target of the falling wedge are: Strong weekly resistance at $25000 and a 50 weekly moving average at $24000.
The falling wedge is a strong reversal pattern, especially at the bottom. The width of the wedge head works as a target after breaking out.
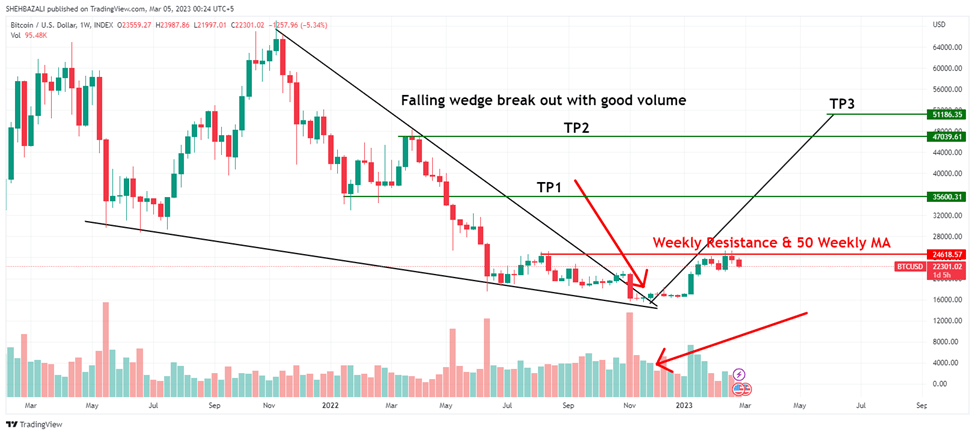
The red line in the chart is strong weekly resistance from where bitcoin (BTC) was rejected last month. If bitcoin breaks above the $25000 mark and closes 2-3 weeks above it, the first target is $35600, the second target will be $47000 and the third target will be $51000.
Why I am giving so much importance to the 50 weekly moving average? Because historically, the 50 weekly moving average is only the average worked as the borderline between the bull market and bear market.
The inverted Head & Shoulder Pattern
The second bullish reversal pattern that bitcoin is forming at the moment is an Inverted Head & Shoulder. This decline in the price of bitcoin suggests that the bitcoin is on its way to filling the area of the right shoulder before moving up.
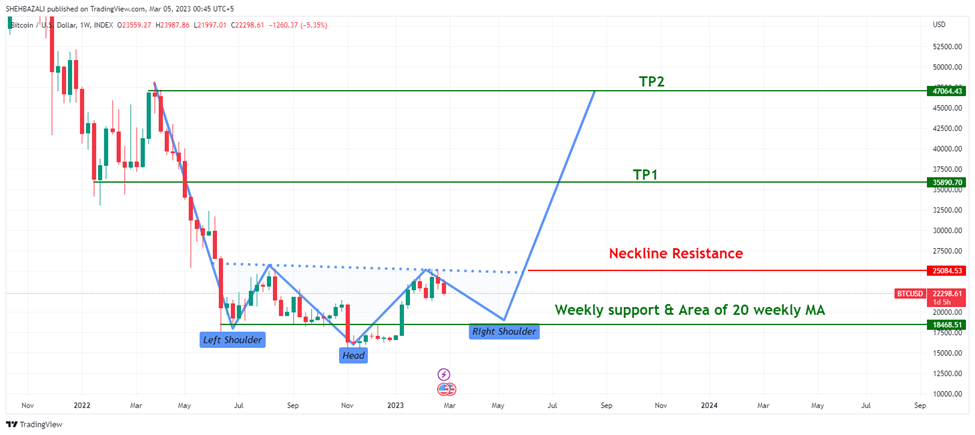
According to the data from Tradingview, Bitcoin can come as low as $19000 to form a right shoulder of the bullish pattern. At $19600, there is strong weekly support and a demand zone that can help prices to bounce from here.
The neckline of the pattern denoted with the red line in the chart will remain a strong resistance for bitcoin in the coming weeks.
However, if bitcoin (BTC) closes a week above the neckline, the first target will be the next weekly resistance which is $35000 and the second target will be $47000.
Conclusion
Both patterns are bullish reversal patterns. Both patterns are valid as long as bitcoin is above $15000. The bullish Head & Shoulder will become invalid if bitcoin forms a new low because the shoulder cannot drop below the head.
The new low has extremely low chances as discussed last month. Both patterns will perform in a crazy way when bitcoin will close a few weeks above $25000.
You may be also interested to read more about
- Binance Braces for Potential Fines from US Regulators
- Silvergate – Cryptocurrency-focused Bank is in a Pickle
- Why is Dubai an Attractive Crypto Oasis?
- Hong Kong plans to make crypto purchase and trading legal for all of its citizens
- Crypto Industry is Under Siege by Regulators
Images from: IStock and Tradingview
*Disclaimer: All views expressed in this article is for educational purposes only and should not be constituted as financial advice. This is an opinion article from the author and not necessary CNB.