
NASDAQ:
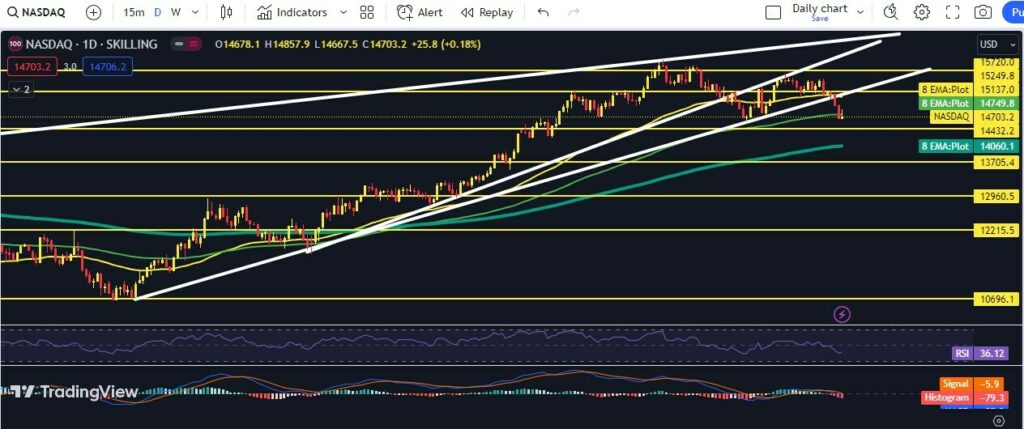
NASDAQ concluded the week at $14,703.2, registering a modest 0.18% uptick on the final day of the week. Notably, NASDAQ ended the day below its 100-day Exponential Moving Average (EMA). The previous week saw a substantial decline in NASDAQ prices, with a 3.3% drop. An important support level at $14,750 was breached, and NASDAQ is currently trading below it. The market’s ability to regain this support will be crucial; otherwise, we may anticipate further sell-offs in the coming days. Presently, NASDAQ finds support at $14,430, a pivotal level that, if breached, could exert significant selling pressure across all stocks. Of significance is NASDAQ’s shift from a higher-highs and higher-lows pattern to a bearish channel characterized by lower-lows and lower-highs. The 200 EMA holds particular significance as a historical support level for NASDAQ, often serving as a springboard for price rebounds. However, it is imperative for traders and investors to exercise caution, as breaking below the 200 EMA has historically led to substantial price declines. Staying informed about market news and trends is crucial for making informed trading and investment decisions. Technical indicators currently suggest a bearish momentum in NASDAQ. Access previous analysis on NASDAQ, SPX, DXY and BTC by clicking here.
READ MORE:
SPX:
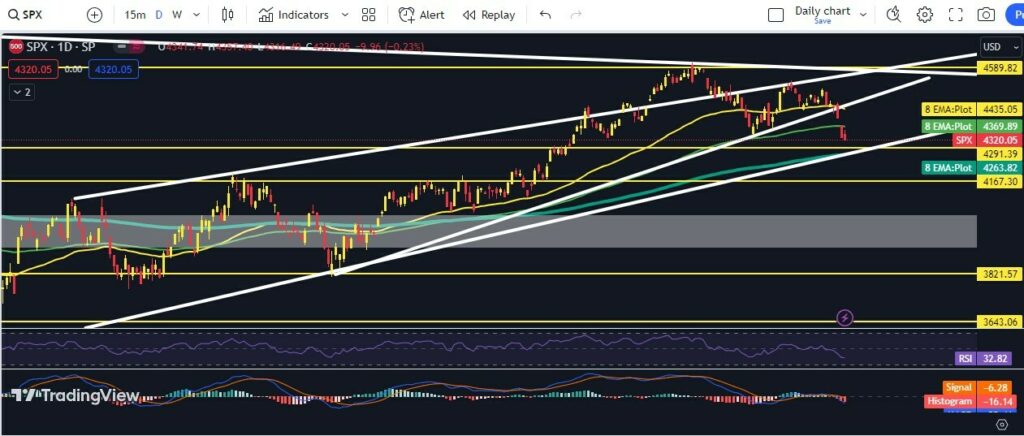
SPX wrapped up the week at $4,320, experiencing a 0.23% decline on the last trading day. Similar to NASDAQ, SPX witnessed a significant drop of 2.93% last week, which was previously forecasted in our analysis. SPX, like NASDAQ, broke below its 100-day EMA and revisited its previous low from the higher-highs and higher-lows pattern. Presently, there are two critical support levels for SPX at $4,291 and $4,263. The $4,291 level is particularly significant as it combines both a horizontal support and a long-term trendline, offering a robust support base for SPX. The $4,263 level derives importance from the presence of the 200 EMA, serving as another vital support. It is essential to hold the long-term trendline, as a breach would open the door to a confluence level around $4,167. Technical indicators currently point to a bearish momentum for SPX, which could lead to a substantial price drop.
ALSO READ:
DXY:
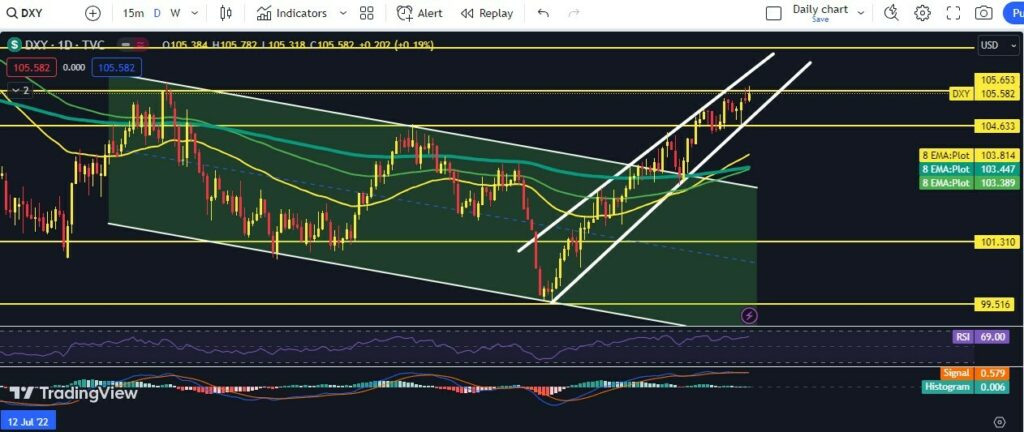
DXY broke free from its parallel channel and embarked on an impressive upward trajectory. It currently stands at 105.58, successfully reaching the 105.6 target mentioned in our previous analysis. DXY is presently trading within an ascending wedge pattern, with the lower wedge line serving as a robust support, propelling prices upward consistently. If DXY manages to close a day above 105.6, the next target for DXY would be 107, where it could face some resistance. It is worth noting that as DXY and risk markets typically move inversely, an uptick in DXY could lead to lower prices for risk assets, including stocks. Technical indicators strongly signal upward momentum for DXY.
IMPORTANT TOPIC:
BTC:
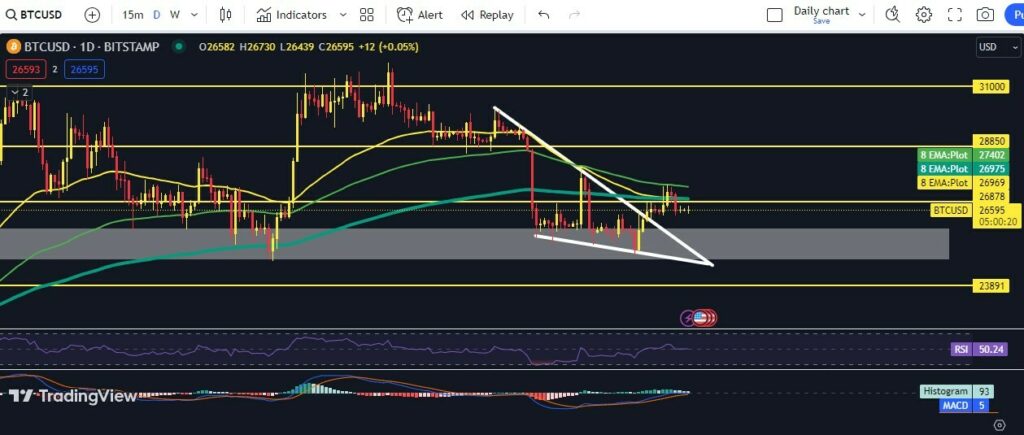
BTC is currently trading below a critical support level and consolidating beneath it. In the short term, BTC appears to be following a pattern of lower-highs and lower-lows. Notably, BTC finds support at $26,000 and $25,000. The $25,000 level carries substantial significance as it could determine the trajectory of Bitcoin over the next 3 to 6 months. This level also draws support from previous lows, the weekly 200 EMA, and the monthly 50 EMA. BTC is presently trading below key EMA levels, including the 50, 100, and 200 EMAs, and a sell-off could be anticipated if both NASDAQ and SPX experience declines. While technical indicators offer some signs of relief, transforming the zone between $26,900 and $27,400 into solid support is vital for BTC’s resurgence.
SUGGESTED FOR YOU:
- Market Watch: Will Ethereum drop to $1120 and Bitcoin To $20,000 ? Lets look into this bear analysis
Conclusion:
In conclusion, the financial markets, including NASDAQ and SPX, are currently navigating a challenging landscape with various support levels being tested. NASDAQ’s shift from a higher-highs and higher-lows structure to a bearish channel of lower-lows and lower-highs warrants caution among traders and investors. Maintaining the 200 EMA as support is crucial, as history has shown it to be a pivotal level for NASDAQ.
Similarly, SPX is facing headwinds with significant declines observed recently. The breach of its 100-day EMA and the shift away from its previous bullish pattern indicate a potential for further price drops. Critical support levels at $4,291 and $4,263 will be instrumental in determining SPX’s future trajectory.
In the currency markets, DXY has demonstrated impressive strength, breaking out of its parallel channel and setting higher targets. The inverse relationship between DXY and risk assets underscores the importance of monitoring its movements for potential impacts on stock prices.
In the world of cryptocurrencies, BTC is grappling with crucial support levels, with $25,000 serving as a make-or-break point for its longer-term prospects. Technical indicators provide some hope, but establishing strong support between $26,900 and $27,400 is essential for BTC’s resurgence.
As always, traders and investors should stay vigilant, keep abreast of market news and trends, and exercise caution in their decision-making processes to navigate these dynamic financial markets successfully.
Charts from TradingView
The information provided in this article is for informational purposes only and should not be considered financial advice. The article does not offer sufficient information to make investment decisions, nor does it constitute an offer, recommendation, or solicitation to buy or sell any financial instrument. The content is opinion of the author and does not reflect any view or suggestion or any kind of advise from CryptoNewsBytes.com. The author declares he does not hold any of the above mentioned tokens or received any incentive from any company.