

- In-depth analysis of $KSM macro chart and market trends for informed investment decisions.
- Identification of iH&S pattern and bearish outlook on $BTC influencing $KSM’s trajectory.
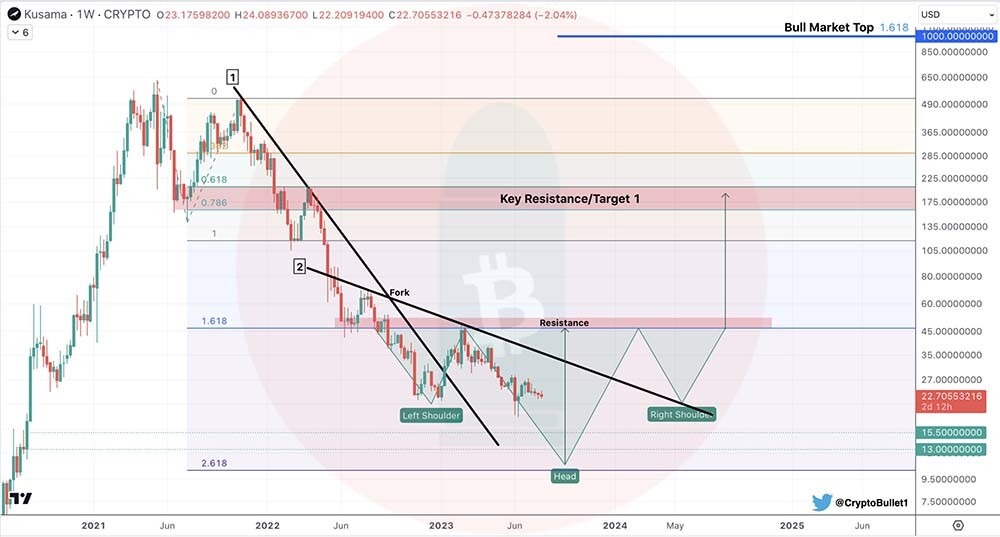
- Price targets: $160-200 bullish range, $36 target for bull flag completion.
In this comprehensive analysis, we delve into the macro chart of Kusama ($KSM), examining its recent price movements and providing insights into its potential future trajectory. These analysis are by CryptoBullet, With a focus on key technical indicators and market trends, we aim to provide valuable information for investors and traders alike.
Q1 2023 Pump and Q2 Fade
The first quarter of 2023 saw a significant pump in the price of $KSM, initially appearing convincing to many market participants. However, as the second quarter unfolded, the bullish momentum faded, raising questions about the sustainability of the upward trend. Despite this setback, we believe that the overall market sentiment indicates a period of accumulation for $KSM.
Formation of iH&S Structure
Our analysis indicates that Kusama is currently forming an inverse head and shoulders (iH&S) pattern. This chart pattern is often regarded as a bullish signal, suggesting a potential trend reversal. At present, we are approximately halfway through the formation of this pattern, indicating that there may be further upward movement in the future.
$KSM and Bearish Outlook on $BTC
Given our bearish outlook on Bitcoin ($BTC) for the remainder of the year, we anticipate that $KSM will follow suit and experience a nosedive, potentially dropping below $15. It is important for investors to consider this bearish scenario and adjust their strategies accordingly.
Price Targets and Outlook
Based on our analysis, we have identified specific price targets for $KSM:
Target 1: $160-200
We anticipate that $KSM has the potential to reach a price range of $160 to $200. This target represents a significant increase from the current price levels and could attract considerable attention from investors.
Bearish Outlook on $KSM
Zooming in on the chart, the current price action of $KSM appears bearish. The market sentiment suggests a downward trend, indicating the possibility of further price declines in the near term.
Recent Developments and Flag Completion

In recent updates, $KSM has experienced a notable rally off the bottom target identified in our analysis. This rally has been accompanied by the successful reclamation of an important horizontal level, indicating renewed strength in the market. Furthermore, the formation of a bull flag pattern suggests a potential continuation of the upward movement.
Target of the Bull Flag: $36
The bull flag pattern suggests a target price of $36 for $KSM. This level represents a potential upside opportunity for traders and investors who are considering entering or expanding their positions in the market.
Conclusion
In conclusion, our analysis of the $KSM macro chart indicates a period of accumulation and the formation of an iH&S pattern. While we maintain a bearish outlook on $BTC, we anticipate a potential nosedive for $KSM. However, we also highlight the bullish price targets of $160-200 and the completion of a bull flag pattern with a target of $36. It is crucial for market participants to conduct further research and analysis to make informed investment decisions. Stay updated with the latest market developments to navigate the dynamic landscape of cryptocurrency trading.
Disclaimer
The information provided in this article is for informational purposes only and should not be considered financial advice. The article does not offer sufficient information to make investment decisions, nor does it constitute an offer, recommendation, or solicitation to buy or sell any financial instrument. The content is opinion of the author and does not reflect any view or suggestion or any kind of advise from cryptonewsbytes.com. The author declares he does not hold any of the above mentioned tokens or received any incentive from any company.
images sources & Featured image


