

- A crypto analyst’s mid-term plan update for SOL (Solana) reveals a bearish divergence between its price action and RSI within the resistance zone, suggesting a potential reversal in price trend.
- The significance of this bearish divergence within the resistance zone calls for caution among investors and traders, who should closely monitor SOL’s price behavior in this critical area.
- The analysis indicates a potentially toppish sentiment, presenting an opportunity for traders to take profits or sell spot positions and manage their risk exposure effectively.
In this mid-term plan update for SOL (Solana), we delve into the current market conditions surrounding SOL and provide valuable insights to assist investors and traders in making informed decisions. Our examination reveals a significant bearish divergence within the resistance zone, suggesting a potential reversal in SOL’s price trend. Please note that our analysis does not serve as a short call, but rather presents an opportune moment to consider taking profits or selling spot positions. Let’s explore the critical factors contributing to this assessment.
Higher High on Price vs. Lower High on RSI – Bearish Divergence
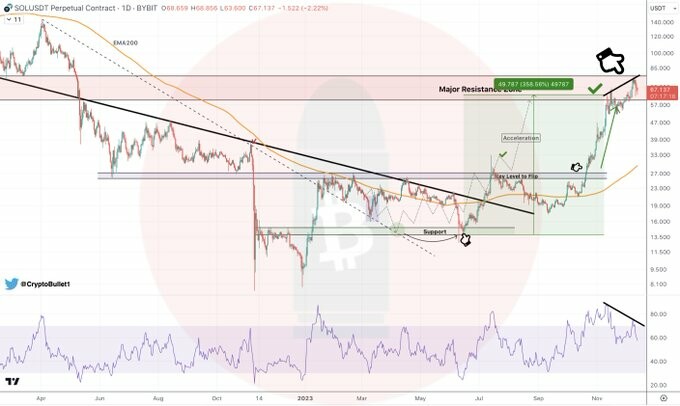
One of the primary indicators signaling a potential shift in SOL’s price dynamics is the bearish divergence observed between its price action and the Relative Strength Index (RSI) within the resistance zone. Despite SOL reaching a higher high on the price chart, the RSI has formed a lower high. This divergence signifies a weakening bullish momentum and hints at the possibility of a forthcoming bearish trend. Investors and traders are advised to exercise caution and carefully evaluate their positions in light of this development.
The Significance of the Resistance Zone
The occurrence of this bearish divergence within the resistance zone amplifies its significance. Resistance zones represent price levels where historical selling pressure outweighs buying pressure, often leading to potential reversals or periods of consolidation. Identifying bearish signals within this critical area adds weight to the analysis and warrants close attention. Traders and investors should closely monitor SOL’s price behavior within this zone to make well-informed decisions.
Toppy Sentiment and Profit-Taking Opportunity
While our analysis does not definitively indicate a short call, it does suggest that SOL appears to be approaching a potentially toppish point. This sentiment aligns with the bearish divergence we observed earlier, further emphasizing the need for caution. Traders may view this moment as an opportunity to take profits or sell spot positions, capitalizing on the potential price reversal. By exercising prudence and seizing suitable profit-taking moments, traders can effectively manage their risk exposure and optimize their investment strategies.
Conclusion
In conclusion, our comprehensive analysis of SOL’s mid-term plan update highlights a bearish divergence between its price action and RSI within the resistance zone. This observation, combined with the toppish sentiment, calls for careful decision-making on the part of investors and traders. While it is essential to consider various factors influencing market trends, the insights provided in this analysis serve as a valuable guide to inform trading strategies and risk management. Stay vigilant, continue monitoring SOL’s price movements, and adjust your positions accordingly.
Disclaimer
The information provided in this article is for informational purposes only and should not be considered financial advice. The article does not offer sufficient information to make investment decisions, nor does it constitute an offer, recommendation, or solicitation to buy or sell any financial instrument. The content is opinion of the author and does not reflect any view or suggestion or any kind of advise from cryptonewsbytes.com. The author declares he does not hold any of the above mentioned tokens or received any incentive from any company.
image source


