

- Comprehensive analysis of the ETH macro chart provides valuable insights into potential price movements and bull market targets for Ethereum.
- Topics covered include completion of a Leading Diagonal Formation, bearish divergence, and phases of the bear market.
- Anticipates a higher low and potential rally, with projections for Ethereum to surpass its previous all-time high.
In this comprehensive analysis, From cryptobullet, we delve into the macro chart of Ethereum ($ETH) to identify potential price movements and anticipate the bull market targets. By examining the current patterns and historical cycles, we aim to provide valuable insights into the future trajectory of Ethereum’s price. Let’s explore the key observations and projections that may impact your investment decisions.
Leading Diagonal Formation and Impending Crash
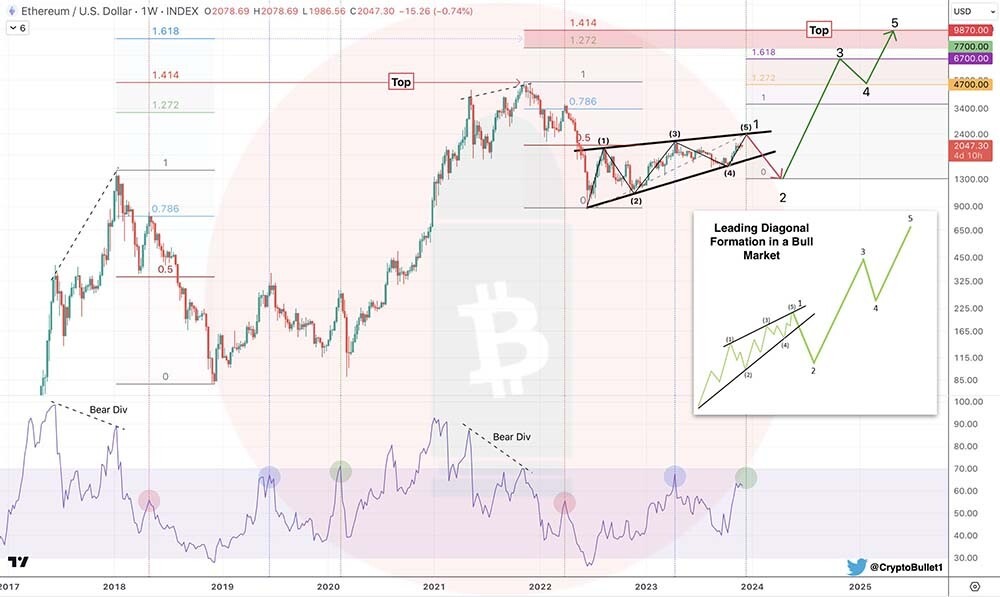
Our analysis suggests that Ethereum is currently completing a Leading Diagonal Formation. This indicates that we can expect a third higher high (5) followed by a subsequent crash. While we believe that the recent low ($880) may be the bottom, it is likely that a higher low will be established in the near future.
Repeating Cycle Structure
By comparing the two cycles we have observed thus far, we have come to the conclusion that the cycle structure is repeating. This finding adds weight to our analysis and helps us anticipate potential price movements in Ethereum.
Bearish Divergence and Tops Out
We have identified a bearish divergence that could indicate an imminent top-out for Ethereum. This divergence is characterized by a higher high on price and a lower high on the Relative Strength Index (RSI). When such a bearish divergence occurs, it often precedes a reversal in price direction.
Phases of the Bear Market
Based on historical patterns, we anticipate the following phases during the bear market of Ethereum:
- Dead Cat Bounce: Ethereum may experience a temporary recovery, known as a dead cat bounce, typically ranging between the 0.5-0.786 Fibonacci retracement levels before entering the main phase of the bear market.
- Relief Rally: Following the dead cat bounce, Ethereum might witness a relief rally, which represents a correction of the entire downtrend. This phase provides temporary respite for investors.
- Bull Trap: The relief rally is often followed by a bull trap, where the price exhibits a temporary upward movement, luring investors into believing that the bear market has ended. However, this phase is typically short-lived and leads to further downward pressure.
Anticipating the Bull Market Bottom and Rally
Considering the above analysis, we anticipate that Ethereum will decline below $1600 to establish a higher low. Once this bottom is confirmed, we can expect a spectacular rally in Ethereum’s price, potentially reaching new all-time highs.
Bull Market Top Target: Breaking the ATH
There is strong evidence to suggest that Ethereum will surpass its previous all-time high (ATH) of $4.8k. In 2021, $ETH peaked exactly at the 1.414 Fibonacci level, which adds credibility to our analysis.
Looking ahead to the future, we project that Ethereum will reach its bull market top somewhere between the 1.272-1.414 Fibonacci levels. This corresponds to a price range of $7700-9900. However, it is important to note that these projections are based on historical patterns and should be considered as potential targets rather than certainties.
Conclusion
In conclusion, our analysis of the ETH macro chart provides valuable insights into potential price movements and the anticipated bull market targets. By understanding the current patterns, historical cycles, and key indicators, investors can make informed decisions regarding their Ethereum investments.
Remember that market dynamics are influenced by various factors, and it is essential to conduct thorough research and seek professional advice before making any investment decisions. Stay updated with the latest market trends and adjust your strategies accordingly to navigate the volatile cryptocurrency landscape.
Disclaimer
The information provided in this article is for informational purposes only and should not be considered financial advice. The article does not offer sufficient information to make investment decisions, nor does it constitute an offer, recommendation, or solicitation to buy or sell any financial instrument. The content is opinion of the author and does not reflect any view or suggestion or any kind of advise from cryptonewsbytes.com. The author declares he does not hold any of the above mentioned tokens or received any incentive from any company.


