

- Dogecoin price movements within the 20-day EMA aren’t looking good.
- The Dogecoin token price might move down to $0.60 to retest the support level.
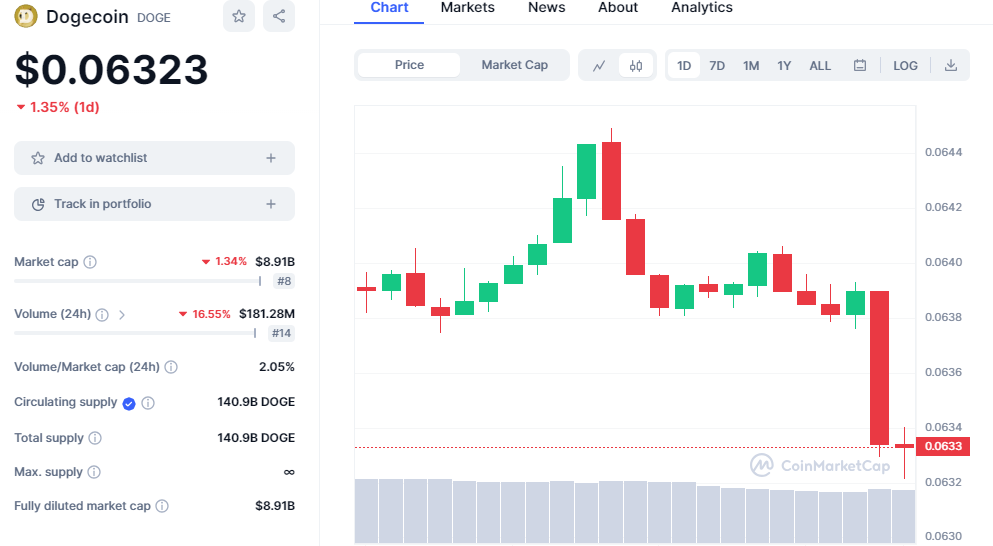
The Dogecoin token is one of the most prominent meme coins in the crypto industry. It even ranks in the top 10 of the crypto market capitalization. However, the recent price actions look very pessimistic.
Why is Dogecoin Token Wasting Time Below 20-Day EMA?
- New data shows the Dogecoin token appears to be wasting some time below the 20-day EMA. However, it looks like there is a bad reason for this. Several chart lines and analyses show the meme coin might be gearing up for a significant bearish run. So, the DOGE price shows a narrow range consolidation moves and hovers below the cluster of $0.07000. But it is not a pessimistic outlook yet. This looks more like a position of neutrality in the charts. Furthermore, the price chart of this meme coin looks like it is in the congestion zone.
- Many things will happen if the Dogecoin token remains below the 20-day EMA. One of them is that the price might retest the $0.60 support level. Nevertheless, the chart also shows Dogecoin might be nearing the $0.07 range in the future. If buyers try to pull back and accumulate, there are chances the token will revisit the 50-day EMA near $0.06800. At the time of writing, Dogecoin’s price isn’t looking positive at $0.63.
Dogecoin Token Still In the Congestion Zone
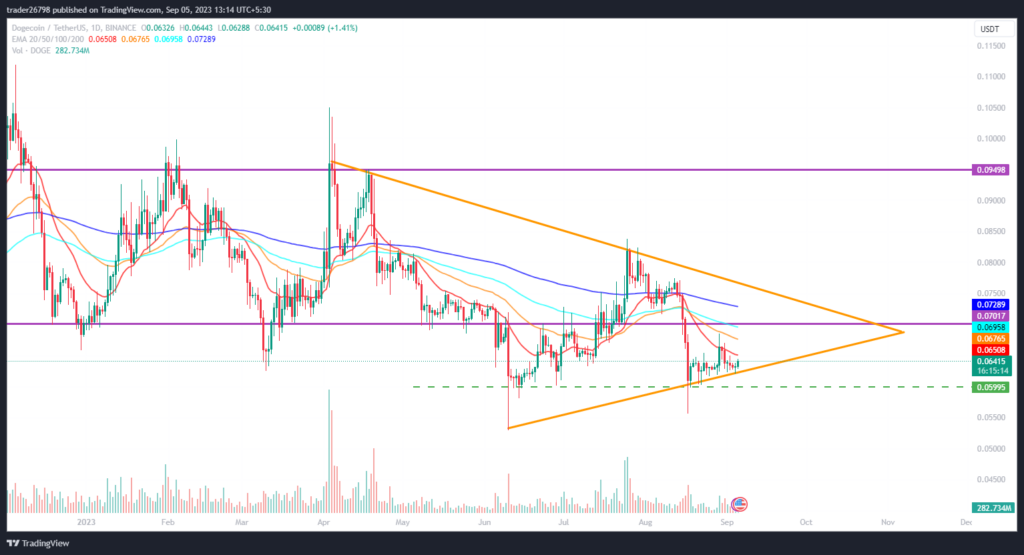
- One of the things to note is that the Dogecoin token is still in the congestion zone. There’s a kind of symmetrical triangle pattern on the daily trading charts, according to TradingView. So, this symmetrical triangle pattern indicates a bounce toward the upper trendline of $0.07000.
- The most important thing is that Dogecoin’s price is within the support zone of $0.60. Nevertheless, there’s a buyer’s grip on the charts. There’s a consistent effort by sellers to keep the price down. So, this pattern shows massive seller dominance and bear activity in the charts. Dogecoin enthusiasts might have to brace up for a price decline.
Verdict of the Technical Indicators?
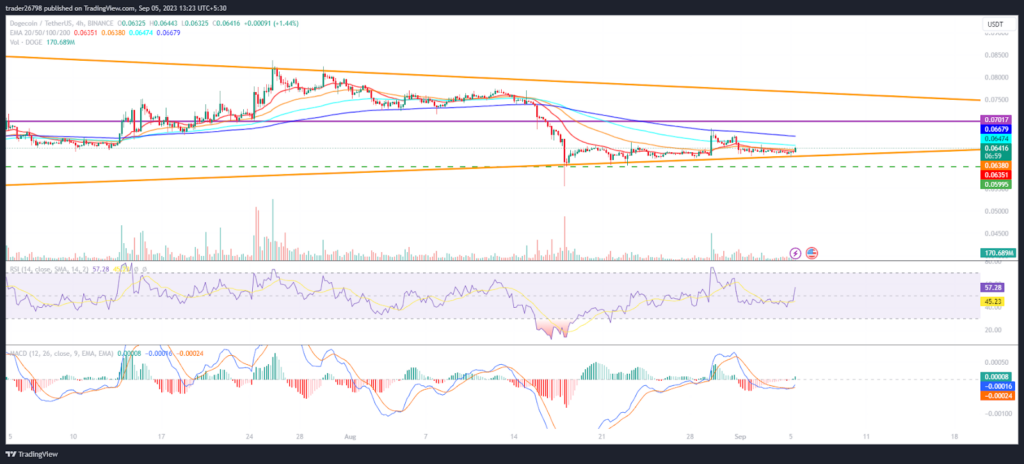
- The technical indicators have similar verdicts to the price movements of the Dogecoin token. Moreover, the price action shows that the DOGE coin price is moving below the 20-day EMA.
- Moving below this level mostly indicates that the meme coin might revisit the $0.0700 range in the future. Moreover, the RSI curve shows a rebound from the oversold region. In other words, Dogecoin price stands the chance of moving lower or higher depending on the market situation.
Conclusion
According to several price actions, the Dogecoin token continues to stay below the 20-day EMA. This means many things for Dogecoin. In fact, it is either positive or negative. On one hand, there’s a chance of the token wriggling out of the current pessimistic price actions. On the other hand, it might also test the $0.60 support level.
–
The information provided in this article is for informational purposes only and should not be considered financial advice. The article does not offer sufficient information to make investment decisions, nor does it constitute an offer, recommendation, or solicitation to buy or sell any financial instrument. The content is opinion of the author and does not reflect any view or suggestion or any kind of advise from cryptonewsbytes.com. The author declares he does not hold any of the above mentioned tokens or received any incentive from the company


