

Investors and traders have been left in a state of shock after Bitcoin’s recent decline to $67,000. The fall was triggered by the release of employment data from the U.S. Labor Department last week. With Bitcoin slipping below $70,000, the pressure on the support trendline and demand at lower levels also increased.
With Bitcoin under pressure, the broader crypto market is facing resistance, and a quick bounce seems unlikely. The sentiments are mixed, especially for the FOMC meeting on June 12th. So, the question on everyone’s mind is whether the increased volatility will lead to a further drop to $60,000 or if a potential rate cut could boost Bitcoin back to $80,000.
BTC Price Performance
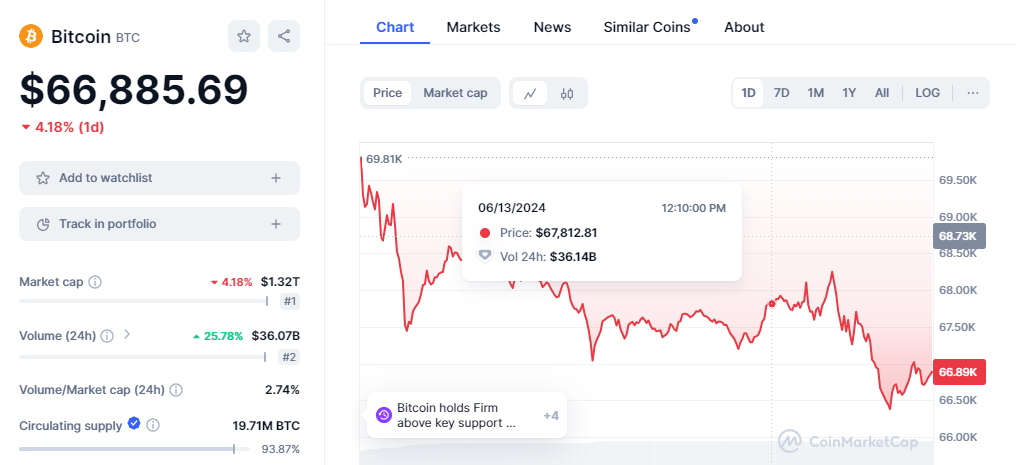
As of now, Bitcoin’s price is trading at $69,533 with minimal movement during the early Asian trading hours. Over the weekend, Bitcoin stayed above $68,800 as trading volumes shrank. However, the bearish reversal last week has tested the support trendline of the ongoing recovery rally.
The market is watching closely to see if Bitcoin can break through this resistance and begin its ascent towards $80,000. There is potential for a bullish rally, but it depends on whether Bitcoin can maintain its current support levels.
Dovish Derivatives to Tease Bitcoin Bull Run
Bitcoin’s funding rate stands at 0.00971315 per CryptoQuant, showing a cost to maintain long positions. Open interest has surged to $19.1 billion, meaning a 2.51% increase in the last 24 hours and a 9.98% rise over the past week. The improving data in the derivatives market shows that underlying sentiments will turn dovish and lead to a surge in Bitcoin prices.
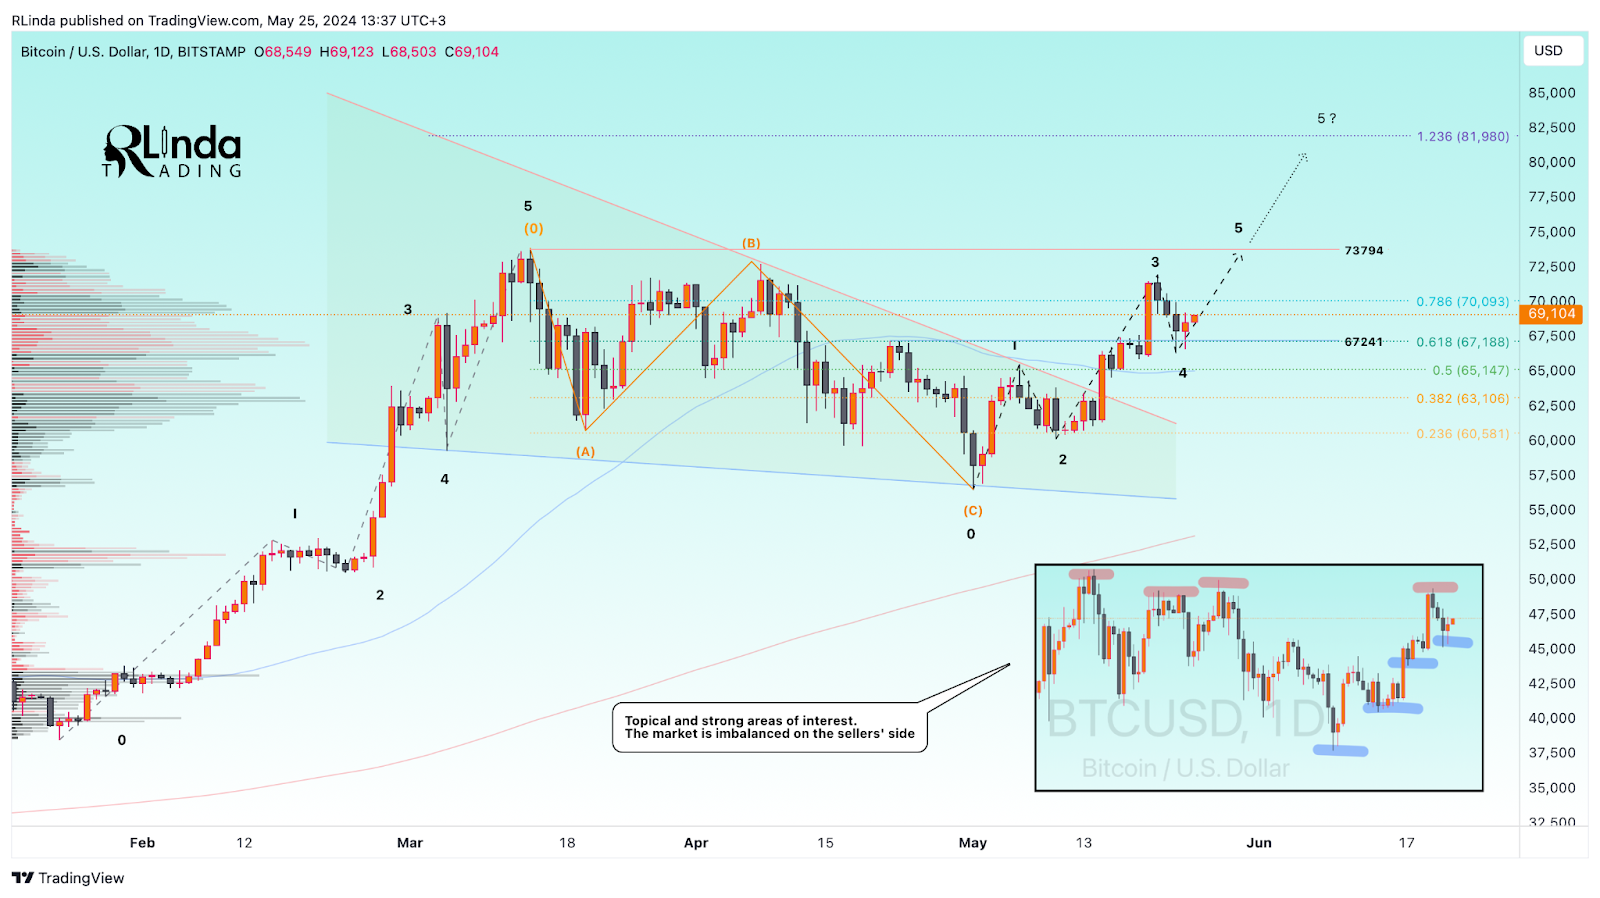
According to trend-based Fibonacci levels, Bitcoin’s bull run could target $81,873, which aligns with the 61.80% level. Conversely, a crash on June 12th could stress the support trendline and test the 50D EMA at $66,961 if a breakdown occurs.
The Impact of the Relative Strength Index on Bitcoin
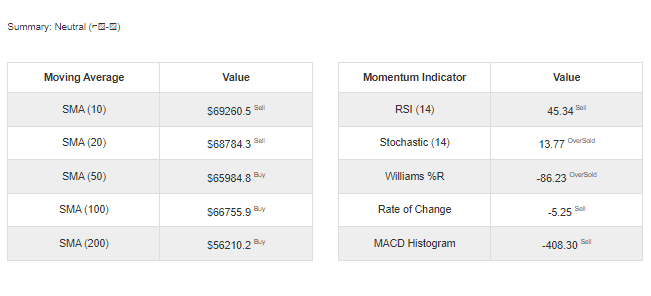
Bitcoin’s price maintains stability above its resistance levels, showing a positive trend. The Relative Strength Index (RSI) currently reads 65.21, indicating bullish momentum. Moving averages also support a bullish outlook, with the 50-day MA crossing above the 200-day MA.
This technical setup suggests that Bitcoin could further gain. According to CryptoChartsJoe on X, formerly known as Twitter, “Bitcoin is doing exactly as expected. We may close red today or tomorrow as we’re hitting a very strong ‘time count.’ Looking for continued upside long-term, once we clear $80K, Bitcoin will be pulled like a magnet to $120K.”
The RSI’s current level and the bullish crossover of the moving averages indicate that Bitcoin could rally. If Bitcoin can maintain its current momentum and break through key resistance levels, a move toward $80,000 is likely.
Conclusion
Bitcoin’s recent price movements have created a volatile market environment. The drop to $67,000 puts pressure on support levels, and the upcoming FOMC meeting creates uncertainty. However, if certain conditions are met, the potential for a rebound to $80,000 remains. The BTC price performance, dovish sentiments in the derivatives market, and bullish technical indicators all point towards a possible rally.
Cover image from Microsoft Designer
The information provided in this article is for informational purposes only and should not be considered financial advice. The article does not offer sufficient information to make investment decisions, nor does it constitute an offer, recommendation, or solicitation to buy or sell any financial instrument. The content is opinion of the author and does not reflect any view or suggestion or any kind of advise from cryptonewsbytes.com. The author declares he does not hold any of the above mentioned tokens or received any incentive from the company.


